Statistical Learning: 12.3 k means Clustering
Key Takeaways
The video discusses K-means clustering, a method for finding subgroups or clusters in data, and its application in statistical learning, including the process of pre-specifying the number of clusters, minimizing within-cluster variation, and the connection to principal components. The K-means algorithm is explained, including its sensitivity to the choice of K, and the importance of starting the algorithm from multiple random configurations to avoid local minima.
Full Transcript
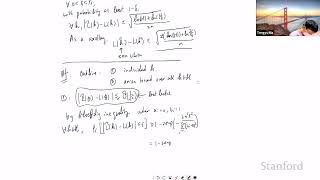
okay well welcome back the second method of this section is clustering um which refers to a broadside of techniques for finding subgroups or or clusters in data so we're trying to segment or or or partition the data into subgroups that are are similar to each other and of course we'll have to Define what we mean by similar or different to in order to do do the partitioning and um in a lot of cases the the the way we decide to Cluster the way we decide on what's similar or different depends on the context so how does uh principal components analysis which we just discussed uh how does it contrast with clustering well PCA as we've seen looks for a low dimensional representation or view of the data that explains a good fraction of the variance right so we saw the PCA plots and we we from it we derive new variables which could be used for other methods like supervised learning um clustering on the other hand looks for homogeneous subgroups of the observations okay so it's not not looking for variance but looking it's looking for similarity among observations um for example if we we're trying trying to do a segmentation of a market suppose for um each of a number of customers we have we we we've measured things like their income their occupation how far they they live to the closest urban area and so forth and we want to sub we want to segment them or group them into into uh uh customers that are similar with regard to these features and why do we want to do that because maybe if they're similar with regard to these features then the the that the kind of advertising we use for that subgroup will be uh important so we use a certain kind of advertising for one subgroup like maybe young males who have a lot of money one subgroup another subgroup might be like me like uh yeah young man uh okay uh another group might may be um uh Housewives who in their 50s who um you know their children have grown up and they they're they like to travel for example so you may want to advertise in different way to that sub group so um that the task of segmenting that kind of population is is is a um key application of clustering so we're going to talk about two clustering methods in this section now there are lots more as in most areas of Statistics there's a many many ways of doing things but the two most important methods which we talk about our K means clustering in which we first while predefine K the number of clusters and then we have we we'll see there's a way of grouping the observations into the K groups then of course we'll have to Define what K is this number of subgroups and that's going to be an important and hard difficult choice and the second method is called hierarchical clustering which we don't pre-specify the number of clusters K but rather we do um we group the data in all numbers of clusters and it's done in a hierarchical agglomerative fashion and this is nice because we get to see the the uh the clustering for all numbers of of clusters K but let's start with the simplest method K means clustering um before we describe it let's just let's see an example of of the results of Cam's clustering so this is some simulated data um and it's been simulated basically in two groups which are the the upper group there's two features and there's a a group at the top some space in between and a group at the bottom okay and now uh when we apply K means clustering and we have to pre-specify K again we'll see the the procedure in a few slides but when we prespecify k 2 and we run the clustering algorithm it produces the the groups indicated by the two colors blue and gold okay so with k equal 2 it's found approximately the right clusters although you might argue well does this point actually belong in the upper cluster rather than the bottom cluster and that that's not something which you can answer just in a quantitative way that's a that's a a subjective call um in any case it seems to found the two clusters uh pretty pretty correctly but if I were to have specified k equals 3 it would be forced to find three groups and the three groups K means clustering found are indicated here by the green the blue and the gold so what it's done is it's broken up this apparently homogeneous cluster into two clusters similarly with k equal 4 it finds the blue the orange the purple and the green right so it's it's broken up this bottom cluster looks like into three clusters although it's borrowed some points from the top right there so you can see that the effect of K means clustering well first of all you can see the effect of K is really important right because you choose K to be too large it's going to be forced to to uh to break up groups like this one which are fairly homogeneous it's what's also interesting Rob is that variables that are somewhat responsible for clusters like for example this the second variable that we have over here um also tend to have high variance because you know if if they separate the data in in in clusters that there tends to be Vari so so there's some connection between principal components and clustering in a in a more abstract sense okay so let's let's actually drill down in the details of K means clustering well first of all we have to Define uh some some rotation for for for clusters or sets so we'll call them C1 through CK and they're sets of of of indices of the observations so the indices are 1 through n those are our n observations each of these C's is going to be a subset of 1 through n okay and this the subset is going it's going to be a partition of 1 through n if we want to get formalistic we'll say well the C's their Union is 1 through n so if we if we concat them all together they make up 1 through n so they're a partition of 1 through n and there's no intersection so there's no overlap between the Clusters so this just a fancy way of saying we're going to we're going to break up the points 1 through n into um K groups which are non-overlapping and cover the whole set okay and again if if the I observation is in the K cluster then I will be a member of the indices for Group K okay so again we we want to somehow find the partition C1 through CK which is a good clustering well what do you mean by good clustering well K means clustering defines good clustering to have to be one in which the within cluster variation is small okay so let's get back to this picture if you ask me well divide this into say two groups well the notion that K means is going to use to say well I'm going to two groups so that within each group like within the gold the variation is small within the group so that the points are close together similarly for this group the points are close together it's kind of a very intuitive definition so let's call the L cluster variation of the cluster CK wcv for wind cluster variation of CK it's the total variation okay for example we could use Square distance in the two directions matter of fact most of the time we will use Square distance for K means clustering so then if we put it all together if we Define the the variation within a cluster to be wcv of CK we want to find well the total variation uh adding up overall clusters is here and we we want to find the partitioning C1 through CK to minimize the total within cluster variation okay so we're going to assign the end data points to K clusters so that the total within cluster variation summed up over the K cluster is as small as possible so I said this on the previous slide but here's it in detail uh we normally Define within cluster variation to be the ukian distance the the pair y squar distance between each pair of observations in the cluster right added up over the P feature so this is the the ukian or Square distance between observations I and I Prime and we sum it up over all I I Prime in the cluster so now this is the total pairwise distance of every between every pair in the in the in the cluster CK okay and we're going to minimize the total of this over K the total variation over all clusters and that's here it is so here's our optimization problem now here's the within cluster variation um and we're going to we're going to uh find that the the clustering C1 through CK that minimizes that so um we have a Criterion but let's actually uh talk about the K means algorithm and then we'll then we'll we'll sort of circle back and and see why it it minimized the objective on the previous slide so how K means clusterings works well it's got the word means in it so it's going to use a mean somehow so it's it's actually an alternating algorithm that first of all we assign uh to each observation a cluster from 1 to K so remember K is fixed we have to decide ahead of time I'm going to pick k equals for example 2 or k equals 3 and we'll worry later about how to choose K an important value but let's fix k for the moment so if each observation is assigned to a cluster run through K and then we we have two steps which we alternate back and forth for each of the K clusters on the one one hand we compute the centroid that's the average value in for each feature of all the points in the centroid in the cluster okay so just it's the mean of in the vertical and horizontal direction of the points in that in that cluster so having computed the centroids for each of the Clusters on the other step we we do we we assign each each data point to the closest centroid okay and then having done that we have uh a new set of cluster assignments C1 through CK we go back and we compute new centroids using the new centroids we complete new assignments and we alternate back and forth until hopefully this thing settles down and the solution is the K means clustering uh the solution we really want is the assignment points to the to the groups so let me actually I'm going to show an example well let's see an example then we'll go back and and and and and uh see why that algorithm actually minimizes the objective that we wrote down so here's an example um actually the same example we have before uh here's our data okay again it's unlabeled data right and we've chosen k equal 3 so in the first St step we're going to assign uh points at random to clusters so we have to indicate these by the colors okay and so each Point's assigned to to to a different color and you can see the assignment is is is the grouping is not very good yet in other words we like we're thinking that this is one group and this is another group but we don't we're we're nowhere near that clustering at this point the first step we compute the centroids right so that these are the the average of the the horizontal vertical direction of all of all the points in the gold green and blue groups and here the cids are pretty much on top of each other because the assignment was random so there's no real grouping yet but uh no don't fear the cam clustr will work its way to a good solution so now we take the centroids and we um we find the closest points to each of the centroids so each point is we ask which point are you closest to the green the purple or the orange centroid and now we color the points ly so this is the partitioning step so even though those first three centroids were pretty much on top of each other they weren't exactly and so that defines a fairly nice partition of the data already yeah it's done done an almost almost perfect job in terms well you see we get to the final iterate and then given this new assignment we we find the the centroids again but now the centroids are going to move a lot now right because look where the points are so for example the average of these gold points is way up here so here's the new gold centroid new purple new green now the centroids are sitting really right in the middles of the Clusters and the algorithm will now continue and make a few refinements and here's the final k mean solution from this for this example very intuitive algorithm so let's go back remember we they had the subjective function which was the total within cluster variation we want to minimize right you want to find the partitioning that minimizes this within cluster variation well the question is have we does this algorithm that we wrote down does it achieve that well we can you can actually see that uh the algorithm um will always decrease the value of the objective in each step and you might think about why that is well the key to it really is that you can write the variation the pair wise variation as the V variation around the the the the uh component wise means okay so and this is really the key to K means clustering think about it we really didn't we didn't care about the centroids all we cared about was the clustering but C me's clustering is done is it's it's it's it's put in the it's changed this to an equivalent expression involving the centroid and now C's clustering finds both the component the the component uh C1 through CK as well as the Cent centroids xar and um what it does at each step is it minimizes over CK on the one hand or minimize over the S to on the other hand and each of those steps is going to decrease this Criterion and hence decrease this Criterion okay so if you have same TOS then when you when you come to update the assignment of each point it's going to go to the the the group for which this distance is smallest for fixed IDs and on the other hand if if all the assignments are fixed we know that the sample mean is minimizes the sum of squares and so that's why each of those steps necessarily makes the Criterion go down so this is this is very slick we started off with the problem evolving one set of variables we made it we added another set of variables which we think it make it harder but actually makes it easier right because now because when we do the joint optimization over both sets of variables we get to the answer for for the ones we care about the clustering so that's just a detail of the previous figure which we talked about now oh sorry I missed a point here which is that it's not this algorithm of those gives you a local minimum it's not guaranteed to give the global minimum why not well what does that mean rob a local minimum oh local minimum means that um well the point is is that there could you could start the algorithm from okay okay the local minum I guess means in calculus it means that the the derivative of the function is zero okay it doesn't mean that it's the the lowest point of the function so if a function is not convex you can have a place where the where the derivative or there's a valley which is flat but it's not the lowest value in the whole function right so this algorithm will get to a local minimum get to a place get to a value of the of the the function we're trying to minimize but it won't be the lowest value necessarily so we can think of this this function that we trying to optimize as being like a a big Valley but it's got lots of little sub valleys or little ponds or whatever and you know any minimum is one of those and we can get stuck in one of those right so in the optimization world the idea idea of a convex function which is basically there's only one Valley so if you find a minimum it's a global minimum but this function is not convex in other words it can go up and down and have more than one Valley and the K means algorithm will will land you in a valley but not necessarily the lowest Valley because the function is not convex so actually here's an example this for the same did here's an example where we start the algorithm from six different starting configurations remember our starting configuration was we assigned each point at random to one of the Clusters and this is actually a good thing to do with K means clustering is since we're not guaranteed to get the global minimum we start the algorithm at more than one place and we just examine the value of the Criterion at the end of at the end in each case remember starting the algorithm was this random assignment of points to to the number of clusters you're using all right so when we start the algorithm from different places we get actually quite different solutions don't worry about the fact that the colors are chosen differently like this these are gold and these are green that the coloring is arbitrary but the the partitioning is quite different um and we typically we pick the lowest value there's let's see this guy well these looks like we got three different solutions there three or four different three different yeah three different solutions right I guess the one the ones who colored in red at the top all have exactly the same distance so they're actually all the same the colorings are different but as Rob said the colorings arbitary yeah so the the these solution these four panels give us the the solution with low but the top left and the bottom right are actually different solutions again right okay so uh that's C's clustering we'll actually talk a little bit about the end how to choose K which also be a an issue for hierle clustering which is a topic of our next our next segment
Original Description
Statistical Learning, featuring Deep Learning, Survival Analysis and Multiple Testing
Trevor Hastie, Professor of Statistics and Biomedical Data Sciences at Stanford University - https://statistics.stanford.edu/people/trevor-j-hastie
Robert Tibshirani, Professor of Statistics and Biomedical Data Sciences at Stanford University - https://statistics.stanford.edu/people/robert-tibshirani
Jonathan Taylor, Professor Statistics at Stanford University - https://statistics.stanford.edu/people/jonathan-taylor
You are able to take Statistical Learning as an online course on EdX, and you are able to choose a verified path and get a certificate for its completion. You can choose to take the course in R (https://www.edx.org/course/statistica) or in Python (https://www.edx.org/learn/data-analysis-statistics/stanford-university-statistical-learning-with-python)
For more information about courses on Statistics, you can browse our Stanford Online Catalog: https://stanford.io/3QHRi72
Watch on YouTube ↗
(saves to browser)
Sign in to unlock AI tutor explanation · ⚡30
Playlist
Uploads from Stanford Online · Stanford Online · 10 of 60
1
 2
2
 3
3
 4
4
 5
5
 6
6
 7
7
 8
8
 9
9
 ▶
▶
 11
11
 12
12
 13
13
 14
14
 15
15
 16
16
 17
17
 18
18
 19
19
 20
20
 21
21
 22
22
 23
23
 24
24
 25
25
 26
26
 27
27
 28
28
 29
29
 30
30
 31
31
 32
32
 33
33
 34
34
 35
35
 36
36
 37
37
 38
38
 39
39
 40
40
 41
41
 42
42
 43
43
 44
44
 45
45
 46
46
 47
47
 48
48
 49
49
 50
50
 51
51
 52
52
 53
53
 54
54
 55
55
 56
56
 57
57
 58
58
 59
59
 60
60

Statistical Learning: 13.2 Introduction to Multiple Testing and Family Wise Error Rate
Stanford Online
Statistical Learning: 13.1 Introduction to Hypothesis Testing II
Stanford Online
Statistical Learning: 12.R.3 Hierarchical Clustering
Stanford Online
Statistical Learning: 12.R.2 K means Clustering
Stanford Online
Statistical Learning: 12.R.1 Principal Components
Stanford Online
Statistical Learning: 13.R.1 Bonferroni and Holm II
Stanford Online
Statistical Learning: 12.6 Breast Cancer Example
Stanford Online
Statistical Learning: 12.5 Matrix Completion
Stanford Online
Statistical Learning: 12.4 Hierarchical Clustering
Stanford Online
Statistical Learning: 12.3 k means Clustering
Stanford Online
Statistical Learning: 13.1 Introduction to Hypothesis Testing
Stanford Online
Stanford Seminar - Introduction to Web3
Stanford Online
Stanford Seminar - Designing Equitable Online Experiences
Stanford Online
Stanford CS330: Deep Multi-Task & Meta Learning I 2021 I Lecture 1
Stanford Online
Stanford Seminar - Perceiving, Understanding, and Interacting through Touch
Stanford Online
Stanford CS330: Deep Multi-task & Meta Learning I 2021 I Lecture 2
Stanford Online
Stanford CS330: Deep Multi-task & Meta Learning I 2021 I Lecture 3
Stanford Online
Stanford CS330: Deep Multi-Task & Meta Learning I 2021 I Lecture 4
Stanford Online
Stanford CS330: Deep Multi-task & Meta Learning I 2021 I Lecture 5
Stanford Online
Stanford Seminar - Evolution of a Web3 Company
Stanford Online
Stanford CS330: Deep Multi-task & Meta Learning I 2021 I Lecture 6
Stanford Online
Stanford CS330: Deep Multi-task & Meta Learning I 2021 I Lecture 7
Stanford Online
Stanford CS330: Deep Multi-task & Meta Learning I 2021 I Lecture 8
Stanford Online
Stanford Seminar - Designing Human-Centered AI Systems for Human-AI Collaboration
Stanford Online
The Sh*tFixers: Bob Sutton Interviews David Kelley, Design Thinking Superstar
Stanford Online
Stanford CS330: Deep Multi-task & Meta Learning I 2021 I Lecture 9
Stanford Online
Women Rise: Sheri Sheppard
Stanford Online
Stanford CS330: Deep Multi-task & Meta Learning I 2021 I Lecture 10
Stanford Online
Stanford CS330: Deep Multi-task & Meta Learning I 2021 I Lecture 11
Stanford Online
Stanford CS330: Deep Multi-task & Meta Learning I 2021 I Lecture 12
Stanford Online
Stanford CS330: Deep Multi-task & Meta Learning I 2021 I Lecture 13
Stanford Online
Stanford CS330: Deep Multi-task & Meta Learning I 2021 I Lecture 14
Stanford Online
Stanford Webinar - Cloud Computing: What’s on the Horizon with Dr. Timothy Chou
Stanford Online
Stanford CS330: Deep Multi-task & Meta Learning I 2021 I Lecture 15
Stanford Online
Stanford Seminar - Multi-Sensory Neural Objects: Modeling, Inference, and Applications in Robotics
Stanford Online
Stanford CS330: Deep Multi-task & Meta Learning I 2021 I Lecture 16
Stanford Online
Stanford Seminar - Toward Better Human-AI Group Decisions
Stanford Online
Stanford CS330: Deep Multi-Task & Meta Learning I 2021 I Lecture 17
Stanford Online
Stanford CS330: Deep Multi-Task & Meta Learning I 2021 I Lecture 18
Stanford Online
Stanford Webinar - Web3 Considered: Possible Futures for Decentralization and Digital Ownership
Stanford Online
Stanford Seminar - Ethics Governance-in-the-Making: Bridging Ethics Work & Governance Menlo Report
Stanford Online
Stanford Seminar - Towards Generalizable Autonomy: Duality of Discovery & Bias
Stanford Online
Stanford Seminar - ML Explainability Part 1 I Overview and Motivation for Explainability
Stanford Online
Stanford Seminar - ML Explainability Part 2 I Inherently Interpretable Models
Stanford Online
Stanford Seminar - ML Explainability Part 3 I Post hoc Explanation Methods
Stanford Online
Kratika Gupta talks about Stanford's Product Management Program
Stanford Online
Stanford Seminar - Making Teamwork an Objective Discipline - Sid Sijbrandij CEO & Chairman of GitLab
Stanford Online
Stanford Seminar - ML Explainability Part 4 I Evaluating Model Interpretations/Explanations
Stanford Online
Stanford Seminar - Adaptable Robotic Manipulation Using Tactile Sensors
Stanford Online
Stanford Seminar - ML Explainability Part 5 I Future of Model Understanding
Stanford Online
Meet Joe Lapin, Innovation and Entrepreneurship Program Completer
Stanford Online
Stanford Seminar: Social Media Scrutiny of Frontline Professionals & Implications for Accountability
Stanford Online
Stanford Seminar - Alphy and Alphy Reflect: creating a reflective mirror to advance women
Stanford Online
Stanford Webinar - The Digital Future of Health
Stanford Online
Stanford CS229M - Lecture 1: Overview, supervised learning, empirical risk minimization
Stanford Online
Stanford CS229M - Lecture 2: Asymptotic analysis, uniform convergence, Hoeffding inequality
Stanford Online
Stanford CS229M - Lecture 3: Finite hypothesis class, discretizing infinite hypothesis space
Stanford Online
Stanford Seminar - Decentralized Finance (DeFi)
Stanford Online
Stanford CS229M - Lecture 4: Advanced concentration inequalities
Stanford Online
Stanford Seminar - Bridging AI & HCI: Incorporating Human Values into the Development of AI Tech
Stanford Online
More on: Unsupervised Learning
View skill →


Related AI Lessons
⚡
⚡
⚡
⚡
Data Preprocessing: Encoding and Feature Scaling in Machine Learning
Medium · Machine Learning
Data Preprocessing: Encoding and Feature Scaling in Machine Learning
Medium · Data Science
The Python Dictionary Trick That Makes Interviewers Smile
Dev.to · Ameer Abdullah
I Compared 50 Python Courses. Here Are My Top 5 Recommendations for 2026
Medium · Python
🎓
Tutor Explanation