Python Tutorial : Unsupervised Learning in Python
Key Takeaways
Introduces unsupervised learning in Python using scikit-learn and DataCamp tutorials
Full Transcript
hi my name is Ben Wilson and I'm a data scientist and mathematician we're here to learn about unsupervised learning in Python unsupervised learning is a class of machine learning techniques for discovering patterns in data for instance finding the natural clusters of customers based on their purchase histories or searching for patterns and correlations amongst these purchases and using these patterns to express the data in a compressed form these are examples of unsupervised learning techniques called clustering and dimension reduction unsupervised learning is defined in opposition to supervised learning an example of supervised learning is using the measurements of tumors to classify them as benign or cancerous in this case the pattern discovery is guided or supervised so that the patterns are as useful as possible for predicting the label benign or cancerous unsupervised learning in contrast is learning without labels it is pure pattern discovery unguided by a prediction task you'll start by learning about clustering but before we begin let's introduce the data set and fixham terminology the IRS data set consists of the measurements of many IRS plants from three different species there are four different measurements petal length petal width sepal length and sepal width these are the features of the data set throughout this course data sets like this will be written as two-dimensional numpy arrays the columns of the array will represent the features the measurements for the individual plants are the samples of the data set these correspond to the rows of the array the samples of the IRS data set have four measurements and so correspond to points in a four dimensional space this is the dimension of the data set we can't visualize four dimensions directly but using unsupervised learning techniques we can still gain insight in this chapter we'll cluster these samples using k-means clustering k-means finds a specified number of clusters in the samples it's implemented in the scikit-learn or SK learn library let's see k-means in action on some samples from the RS data set the RS samples are represented as an array to start import k-means from scikit-learn then create a k-means model specifying the number of clusters you want to find let's specify three clusters since there are three species of iris now call the fit method of the model passing the array of samples this fits the model to the data by locating and remembering the regions where the different clusters occur then we can use the predict method of the model on these same samples this returns a cluster label for each sample indicating to which cluster a sample belongs let's assign the result to labels and print it out if someone comes along with some new iris samples k-means can determine to which clusters they belong without starting over k-means does this by remembering the mean or average of the samples in each cluster these are called the centroids new samples are assigned to the cluster whose centroid is closest suppose you've got an array of new samples to assign the new samples to the existing clusters passed the array of new samples to the predict method of the k-means model this returns the cluster labels of the new samples in the next video you'll learn how to evaluate the quality of your clustering but for now let's visualize our clustering of the irf samples using scatter plots here is a scatter plot of the sepal length versus petal length of the RS samples each point represents an RS sample and is colored according to the cluster of that sample to create a scatter plot like this use PI plot firstly import pipeline it's conventionally imported as PLT now get the X and the y coordinates of each sample sepal length is in the 0th column of the array while petal length is in the second column now call the PLT dot scatter function passing the x and y coordinates and specifying C equals labels to color by cluster label when you're ready to show your plot call PLT dot show it's time to take your first steps in unsupervised learning have fun
Original Description
Want to learn more? Take the full course at https://learn.datacamp.com/courses/unsupervised-learning-in-python at your own pace. More than a video, you'll learn hands-on coding & quickly apply skills to your daily work.
---
Hi! My name is Ben Wilson and I'm a Data Scientist and mathematician. We're here to learn about unsupervised learning in Python.
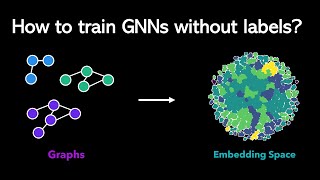
Unsupervised learning is a class of machine learning techniques for discovering patterns in data. For instance, finding the natural "clusters" of customers based on their purchase histories, or searching for patterns and correlations among these purchases, and using these patterns to express the data in compressed form. These are examples of unsupervised learning techniques called "clustering" and "dimension reduction".
Unsupervised learning is defined in opposition to supervised learning. An example of supervised learning is using the measurements of tumors to classify them as benign or cancerous. In this case, the pattern discovery is guided, or "supervised", so that the patterns are as useful as possible for predicting the label: benign or cancerous. Unsupervised learning, in contrast, is learning without labels. It is pure pattern discovery, unguided by a prediction task. You'll start by learning about clustering. But before we begin, let's introduce a dataset and fix some terminology.
The iris dataset consists of the measurements of many iris plants of three different species. There are four measurements: petal length, petal width, sepal length and sepal width. These are the features of the dataset.
Throughout this course, datasets like this will be written as two-dimensional numpy arrays. The columns of the array will correspond to the features. The measurements for individual plants are the samples of the dataset. These correspond to rows of the array.
The samples of the iris dataset have four measurements, and so correspond to points in a four-dimensional space. This is the dimension of the dataset. We ca
Watch on YouTube ↗
(saves to browser)
Sign in to unlock AI tutor explanation · ⚡30
Playlist
Uploads from DataCamp · DataCamp · 0 of 60
← Previous
Next →
1
 2
2
 3
3
 4
4
 5
5
 6
6
 7
7
 8
8
 9
9
 10
10
 11
11
 12
12
 13
13
 14
14
 15
15
 16
16
 17
17
 18
18
 19
19
 20
20
 21
21
 22
22
 23
23
 24
24
 25
25
 26
26
 27
27
 28
28
 29
29
 30
30
 31
31
 32
32
 33
33
 34
34
 35
35
 36
36
 37
37
 38
38
 39
39
 40
40
 41
41
 42
42
 43
43
 44
44
 45
45
 46
46
 47
47
 48
48
 49
49
 50
50
 51
51
 52
52
 53
53
 54
54
 55
55
 56
56
 57
57
 58
58
 59
59
 60
60

SQL Server Tutorial: Date manipulation
DataCamp
R Tutorial: Intermediate Interactive Data Visualization with plotly in R
DataCamp
R Tutorial: Adding aesthetics to represent a variable
DataCamp
R Tutorial: Moving Beyond Simple Interactivity
DataCamp
Python Tutorial: Why use ML for marketing? Strategies and use cases
DataCamp
Python Tutorial: Preparation for modeling
DataCamp
Python Tutorial: Machine Learning modeling steps
DataCamp
R Tutorial: The prior model
DataCamp
R Tutorial: Data & the likelihood
DataCamp
R Tutorial: The posterior model
DataCamp
R Tutorial: An Introduction to plotly
DataCamp
R Tutorial: Plotting a single variable
DataCamp
R Tutorial: Bivariate graphics
DataCamp
Python Tutorial: Customer Segmentation in Python
DataCamp
Python Tutorial: Time cohorts
DataCamp
Python Tutorial: Calculate cohort metrics
DataCamp
Python Tutorial: Cohort analysis visualization
DataCamp
R Tutorial: Building Dashboards with flexdashboard
DataCamp
R Tutorial: Anatomy of a flexdashboard
DataCamp
R Tutorial: Layout basics
DataCamp
R Tutorial: Advanced layouts
DataCamp
Python Tutorial: Time Series Analysis in Python
DataCamp
Python Tutorial: Correlation of Two Time Series
DataCamp
Python Tutorial: Simple Linear Regressions
DataCamp
Python Tutorial: Autocorrelation
DataCamp
R Tutorial: The gapminder dataset
DataCamp
R Tutorial: The filter verb
DataCamp
R Tutorial: The arrange verb
DataCamp
R Tutorial: The mutate verb
DataCamp
R Tutorial: What is cluster analysis?
DataCamp
R Tutorial: Distance between two observations
DataCamp
R Tutorial: The importance of scale
DataCamp
R Tutorial: Measuring distance for categorical data
DataCamp
Python Tutorial: Plotting multiple graphs
DataCamp
Python Tutorial: Customizing axes
DataCamp
Python Tutorial: Legends, annotations, & styles
DataCamp
Python Tutorial: Introduction to iterators
DataCamp
Python Tutorial: Playing with iterators
DataCamp
Python Tutorial: Using iterators to load large files into memory
DataCamp
SQL Tutorial: Introduction to Relational Databases in SQL
DataCamp
SQL Tutorial: Tables: At the core of every database
DataCamp
SQL Tutorial: Update your database as the structure changes
DataCamp
Python Tutorial: Classification-Tree Learning
DataCamp
Python Tutorial: Decision-Tree for Classification
DataCamp
Python Tutorial: Decision-Tree for Regression
DataCamp
Python Tutorial: Census Subject Tables
DataCamp
Python Tutorial: Census Geography
DataCamp
Python Tutorial: Using the Census API
DataCamp
R Tutorial: A/B Testing in R
DataCamp
R Tutorial: Baseline Conversion Rates
DataCamp
R Tutorial: Designing an Experiment - Power Analysis
DataCamp
R Tutorial: Introduction to qualitative data
DataCamp
R Tutorial: Understanding your qualitative variables
DataCamp
R Tutorial: Making Better Plots
DataCamp
SQL Tutorial: OLTP and OLAP
DataCamp
SQL Tutorial: Storing data
DataCamp
SQL Tutorial: Database design
DataCamp
Python Tutorial: Introduction to spaCy
DataCamp
Python Tutorial: Statistical Models
DataCamp
Python Tutorial: Rule-based Matching
DataCamp
More on: Unsupervised Learning
View skill →


🎓
Tutor Explanation
