Measuring Paper Plane Speed with SPIKE Prime Line Graphs
Skills:
Data Literacy80%
Key Takeaways
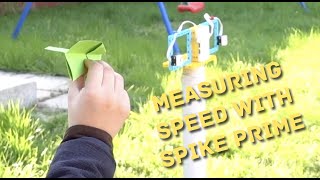
This video demonstrates how to build a light gate using LEGO SPIKE Prime and measure the speed of a flying paper plane using the new line graph tools, by coding a program to plot the data and calculating the average speed.
Full Transcript
g'day everyone today we are in my backyard to learn how to build a light gate using the new graphing features in spike prime so before we do our experiment to see how fast our paper airplane is flying we need to create our light game now you can see here this is a very simple build okay so all it is is the hub in the middle of this plate and we are going to create these two sensors okay we got a blue sensor over here this light color sensor and also this red sensor over here this color coded system is going to be important for us later on okay as a guide what we want to do is we want to create this light gate so that the sensors are as far apart as possible but still close enough for us to measure that paper airplane so because the paper airplane is going to be quite erratic when it's flying um we want to still be able to cut through both of these sensors when it flies through if the sensors are too far apart then it's going to be really difficult for you to fly an airplane straight through but if you were measuring something else like a cart or some sort of bicycle or something like that then then yeah you can have them much further apart and then what we need to do is uh do some very simple code using the new spike prime graphing tools so the code is going to be really easy but in order to access our graphing tools we need to show the block extensions so go to the bottom left here click on show block extensions and then you click on line graph here press line graph and then you close the window now we are going to scroll down and then you'll see that we have some new blocks here so this is plotting a line graph now what we want to do is that when we start our program we want to clear our our line graph in case we've plotted anything already and then we're going to have a forever loop after that we go back down to our line graph blocks and then we're going to plot two things uh one on the blue line and one on a red line now remember i said that we have two color sensors one on a blue clip and one on a red clip that is what these are going to be representing so that we know which uh which color sensor corresponds to which graph so we want the blue one to be our port a so we go into sensors and then we want to measure a's reflect the light intensity and then for the second one we wanted to be measuring port b's light intensity and that's it so when this program starts it's going to clear the line graph and on on your on your graph if it's already drawn anything but then after that it's going to start plotting for a and b so let's download it onto your hub and then let's go outside and test it out we are going to see if we can calculate how fast this paper airplane is flying as it travels past this light gate and then afterwards i'm going to show you how to do the calculations in order to calculate the average speed of your paper airplane [Music] now that we've finished our experiment we're going to bring back our spike prime hub and we're going to plug it in and try to download our information so let's uh get our usb cable uh make sure spike primer is open and then let's plug it in okay so the device is plugged in perfectly fine you can see that our sensors are here it's working as expected so now we want to get the data that was plotted when we were outside so here down the bottom left there is this little graphing symbol so we click on that and then there's uh nothing here at the moment what you need to do is press this full screen button after you press the full screen button you'll start to see things that we can access here so in down the bottom there is this import button we click on import and then choose your hub click on our hub and then you'll see that this is the data from the different lines that we were graphing from before so this blue line and the red line so we select everything and then we press import give it a few seconds here we go so while i was outside uh like i said the airplane is pretty erratic so there's a lot of attempts here but uh i couldn't see uh any really successful uh attempts except for this one little one over here so i'm gonna drag a section around my good data and then i let go yeah all right so now we have these two little blips okay this represents when uh the airplane cut through the blue gate and then the airplane cutting through the red gate so you choose a a place on both of these blips okay so and then we have to try to remember that reading so here is the start of my my blue reading and i'm going to record it as 26.832 seconds so this is 26.832 seconds since the program started running so i'm just going to note this down myself and then it cuts through the red gate at 27.032 seconds so that is the time difference in order to measure the speed we need to detect the distance over time okay so now we have the time readings from looking at the graph but now we need to get the distance between our two sensors and this is an important part of our experiment so we need to make sure we're measuring from the same part of each sensor uh as as accurately as possible so i get my tape measure here and then what i'm going to do is i'm going to measure from this this end of each sensor so it's this end of this sensor and then this end of the red sensor don't measure the outside of both sensors because then you'll be off you have to measure from the same spot of each sensor in order to get an accurate reading so here i'm going to use my tape measure 30.5 centimeters so now we have everything we need in order to calculate that average speed of that airplane as it was flying through this light game the distance that it traveled was 30.5 centimeters and the time is the difference between the red reading and the blue reading point two seconds we can multiply that by five okay so um uh if you if you had another different reading then what you'll need to do is you'll need to divide one second by however many fractions of a second that that you have okay so but uh what we have is point two so we need to multiply the result by 5 and then we'll get meters per second that equals 152.5 centimeters per second so that's 1.525 meters per second and that's it that's how you build a very simple white gate and that's how you calculate the average speed between the likely of anything you can use a paper airplane you can build a little car and see how fast they go or you can measure something in real life maybe you can try and do some of your own experiments with this so i hope you enjoyed it i hope it was helpful and i'll see you next time [Music] you
Original Description
0:20 - light gate construction
1:46 - coding
4:02 - the experiment
4:57 - importing the data
6:28 - measuring time
7:40 - measuring distance
8:37 - calculating speed
We build a light gate to measure the speed of a flying paper plane.
The new line graph tools for LEGO SPIKE Prime bring new data-logging possibilities to the system!
For more in-depth science, building and coding on this subject, visit www.creatoracademy.com.au
LEGO® is a trademark of the LEGO Group of companies which does not sponsor, authorise, or endorse this video.
Playlist
Uploads from Creator Academy Australia · Creator Academy Australia · 56 of 60
1
 2
2
 3
3
 4
4
 5
5
 6
6
 7
7
 8
8
 9
9
 10
10
 11
11
 12
12
 13
13
 14
14
 15
15
 16
16
 17
17
 18
18
 19
19
 20
20
 21
21
 22
22
 23
23
 24
24
 25
25
 26
26
 27
27
 28
28
 29
29
 30
30
 31
31
 32
32
 33
33
 34
34
 35
35
 36
36
 37
37
 38
38
 39
39
 40
40
 41
41
 42
42
 43
43
 44
44
 45
45
 46
46
 47
47
 48
48
 49
49
 50
50
 51
51
 52
52
 53
53
 54
54
 55
55
 ▶
▶
 57
57
 58
58
 59
59
 60
60

LEGO Wedo 2.0 Kangaroo and Joey Demonstration
Creator Academy Australia
LEGO Wedo 2.0 Koala Demonstration
Creator Academy Australia
LEGO WeDo 2.0 Eagle vs Rabbit Demonstration
Creator Academy Australia
Animatronic Australia: The Kangaroo
Creator Academy Australia
How Semiconductors Work: 3D Animation
Creator Academy Australia
LEGO Wedo 2.0 Koala
Creator Academy Australia
First impressions and unboxing First Lego League: Into Orbit 2018
Creator Academy Australia
FLL Into Orbit Team Ranking Gears talks about Artificial Gravity
Creator Academy Australia
FLL Into Orbit team Ev3lution discusses isolation in space
Creator Academy Australia
PI3-BOT (Pie Bot) Prototype
Creator Academy Australia
Dynamic display stand for LEGO Bugatti Chiron (preview)
Creator Academy Australia
Creative Kids TV announcement featuring Creator Academy
Creator Academy Australia
LEGO WeDo 2.0 Guided Lesson: Milo
Creator Academy Australia
LEGO SPIKE PRIME: Turtle Prime Demonstration
Creator Academy Australia
LEGO SPIKE PRIME "Wheelchair Prime"
Creator Academy Australia
10 Reasons why EV3 is SUPERIOR to SPIKE Prime
Creator Academy Australia
Your first launch after installing Python: Python for Kids Webinar Highlight
Creator Academy Australia
What is "Sharpening the Saw": Python for Kids Webinar Highlight
Creator Academy Australia
Why We Use Comments: Python for Kids Webinar Highlight
Creator Academy Australia
Build a Scratch Dinosaur Park (Full Lesson)
Creator Academy Australia
Scratch 3.0: Cat and Mouse Game Stream (Krunal)
Creator Academy Australia
Python Tutorial: Make a Toilet Paper Calculator (Full Lesson)
Creator Academy Australia
Scratch 3.0 Tutorial: Making a chatbot that plays 'heads or tails' (Full Lesson)
Creator Academy Australia
Getting Started with MicroPython on SPIKE PRIME (old)
Creator Academy Australia
Easter Egg Game Tutorial in Scratch (Full Lesson)
Creator Academy Australia
Accessing Weather API with Python (Highlights)
Creator Academy Australia
Accessing Translate API with Python (Highlights)
Creator Academy Australia
Scissors, Paper, Rock with Scratch 3.0 (Highlights)
Creator Academy Australia
Making a really scary game with Scratch 3.0 (Highlights)
Creator Academy Australia
Making a Lemmings game with Scratch 3.0 (Highlights)
Creator Academy Australia
Space Navigation Game in Scratch (Highlights)
Creator Academy Australia
Scratch Supercat Game (Full Lesson)
Creator Academy Australia
Introduction to Robots with LEGO Wedo 2.0 (Full Lesson)
Creator Academy Australia
Getting Started With LEGO Spike Prime (Full Lesson)
Creator Academy Australia
Scratch Walk Cycle Animation Tutorial (Full Lesson)
Creator Academy Australia
Building a Scissor Lift with LEGO Simple Machines (Highlights)
Creator Academy Australia
EV3 datalogging RPM challenge (highlights)
Creator Academy Australia
Learning about buses with LEGO (Full Lesson)
Creator Academy Australia
Make "Flappy Bird" in Scratch 3.0 (Highlights)
Creator Academy Australia
"Memory Arrows" game with Scratch 3.0 Lists (Highlights)
Creator Academy Australia
Learning about Gear Ratios with LEGO Simple Machines (Highlights)
Creator Academy Australia
Scratch 3.0 Bouncing Ball with Stretch, Speed and Acceleration (Full Lesson)
Creator Academy Australia
LEGO SPIKE Prime Order Tracking Robot (Highlights)
Creator Academy Australia
Scratch 3.0 Race Guesser (Full Lesson)
Creator Academy Australia
How Banks Work - a quick explanation for kids
Creator Academy Australia
SPIKE Prime Safe + importance of passwords (Highlights)
Creator Academy Australia
Combination Safe Coding Guide with LEGO SPIKE Prime
Creator Academy Australia
LEGO SPIKE Prime Parcel Scanning Robot
Creator Academy Australia
Building "Addy" the Addition Chatbot
Creator Academy Australia
SPIKE 2.x PID Balancer with Scratch for SPIKE Prime / 51515: Gyro Girl
Creator Academy Australia
What is Procedural Programming
Creator Academy Australia
Zombie game in SCRATCH (plus horrifying zombie facts!)
Creator Academy Australia
Swarming Bugs Scratch Game
Creator Academy Australia
LEGO Mindstorms/SPIKE Prime Scanner and Printer
Creator Academy Australia
Fishing Game with SCRATCH (For Fathers Day!)
Creator Academy Australia
Measuring Paper Plane Speed with SPIKE Prime Line Graphs
Creator Academy Australia
Comparing Mindstorms Robot Inventor and SPIKE Prime
Creator Academy Australia
Code a 'Knock Knock Joke' game in Scratch 3.0
Creator Academy Australia
Creator Academy Australia Live Stream
Creator Academy Australia
Discovering LEGO Mindstorms/SPIKE Gyro Pitch Deadzone
Creator Academy Australia
More on: Data Literacy
View skill →









Related Reads
📰
📰
📰
📰
Don’t Read Another 30-Page Paper Until You Try This
Medium · AI
6.5% of the Neuro-Symbolic Literature Can Be Reproduced from Its Published Artifacts, a Six-Stage Audit Framework and First Instantiation
ArXiv cs.AI
Research Publications, Patents & Innovation Output at Quantum University
Medium · Machine Learning
Every Researcher Should Start Managing Research Intelligence Assets™
Medium · AI
Chapters (7)
0:20
light gate construction
1:46
coding
4:02
the experiment
4:57
importing the data
6:28
measuring time
7:40
measuring distance
8:37
calculating speed
🎓
Tutor Explanation

 DeepCamp AI