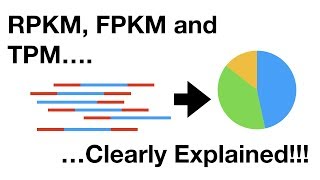
RPKM, FPKM and TPM, Clearly Explained!!!
Key Takeaways
This video explains the differences between RPKM, FPKM, and TPM, which are metrics used to normalize read counts in high-throughput RNA-seq experiments, specifically in the context of StatQuest with Josh Starmer.
Full Transcript
stat Quest stat Quest stat Quest hello and welcome to stat Quest statquest is brought to you by the friendly folks in the genetics department at the University of North Carolina at Chapel Hill today we're going to be talking about rpkm versus fpkm versus fpm in previous stat quests we've talked about topics that are broadly applicable to a variety of fields these subjects however really only relate to high throughput sequencing of RNA so if that's what you're interested in quest on there's a new RNA seek metric on the Block we used to report rpkm or reads per kilobase million or fpkm fragments per kilobase million these normalized read counts for the sequencing depth that's the million part it's because sequencing runs with more depth will have more reads mapping to each gene than sequencing runs with less depth and we don't want that to bias our analysis the other thing that these metrics normalize for are the lengths of genes that's the kilab base part longer genes will naturally have more reads mapping to them than shorter reads and it's important to remove that body from the analysis as well however nowadays they want us to use TPM which stands for transcripts per million So today we're going to talk about these three things and how they're related and how they're different and how I think that using TPM is actually a really good idea let's start with an example to understand the differences between TPM and rpkm and fpkm will work through the math using an imaginary RNA seek data set with three replicates rep 1 2 and three for a genome with only four genes a b c and d on the left we see the names of our genes and the lengths of each gene to the right we see the read counts for each replicate we see that replicate 3 has way more reads than the other replicates regardless of the gene this means it had higher SE sequencing depth than the other replicates we're going to normalize for that we also see that Gene B is twice as long as Gan a and that might explain why it always gets twice as many reads regardless of the replica we're going to normalize for this two first we're going to normalize the data using the familiar rpkm metric with rpkm the first step is to normalize for read depth here we've calculated the total number of reads in each replica for the purpose of this 4 Gene example we're going to scale the total read counts by 10 instead of 1 million this will make the numbers easier to read but in future slides consider tens of reads or millions of reads to be interchangeable just for this example originally 1 million was picked just to make the numbers look nice so they wouldn't require too many decimal places thus these are our per million scaling factors for each replicate and by scaling I mean we're just going to divide the read counts for each gene by the appropriate scaling factor for that replicate and using those per million scaling factors we can calculate the reads per million for each replicate the second step for normalizing by rpkm is to normalize for Gene length here we've got the gene lengths on the left side all we have to do now is scale per kilobase after dividing by the length of the genes the reads are scaled for depth M and for Gene length K so now we have rpkm to summarize rpkm we have our before data which isn't normalized for depth or Gene length but then we normalized for differences in sequencing depth and differences in gene size and so here's our after data our rpkm values for each replicate and each gene now rpkm and fpkm are two very closely related terms however there's a lot of confusion related to them so let's clear that up right now first r rpkm as you know stands for reads per kilobase million fpkm stands for fragments per kilobase million the only difference is that rpkm is for single-end RNA seek and fpkm is for paired in RNA seek to illustrate why it's necessary to make this distinction consider a fragment that is to be sequenced with single end sequencing there is only one read sequenced per fragment that read is either on one end of the fragment or the other end of the fragment in contrast with paired end sequencing both ends can map giving you two reads per fragment or sometimes only one end of the paired end has a quality read and maps in this case you only get one read mapping to a fragment all fpkm does is keep track of the fragments so that one fragment with two reads mapping to it is not counted twice now that we know what rpkm and fpkm are let's talk about TPM or transcripts per million TPM is like rpkm and fpkm except the order of the operations is Switched let's look at an example for TPM the first step is to normalize for Gene length so after dividing each read count by the gene length we have rpk or reads per kbase the second step for TPM is to normalize for sequencing depth we do this by adding up the read counts that have already been normalized for Gene length and get the total for each replica we then divide this total by some number usually that's million but for this for Gene example we're just going to divide by 10 this gives us our scaling factors now we divide the read counts that have already been normalized for Gene length by our new scaling factors and that gives us TPM that's all there is to it we did the same things we did for rpkm and fpkm except in this case we just did them in a different order however this will have profound effects on the results here's a comparison of the same same original data sets scaled for rpkm and TPM above we have rpkm and Below we have TPM both TPM and rpkm correct for biases in gene length and sequencing depth but the sums of total normalized reads in each column are very different in rpkm we get a different value for each sample with TPM we get the same value for each column why is this important I'll show you now consider three pies each the same size in this case each Pi is size 10 the TPM values in each replicate represent slices in these pies and we can tell from each slice What proportion of the total reads in that replicate went to the each gene for example in gene a in replicate one we see that the size of that slice is 3.33 this slice is larger than the slice in replica 3 which is size 3.32 6 so it's just a little the slice and replicate one is just a little larger than the slice and replicate 3 however what this tells us is that of all the reads that mapped to replicate one a larger proportion of them mapped to Gene a whereas of all the reads that mapped in replicate 3 a slightly smaller proportion of them mapped to Gene a this is because some of those reads also mapped Gene D in replicate 3 and none of the reads mapped Gene D in replicate 1 with rpkm it's harder to compare the proportion of total reads that map to each gene because each replicate has a different total overall that is to say each Pi has a different size that makes it difficult to compare the slices between each one the main point with TPM everyone gets the same sized pie all right in all seriousness folks are using TPM because the numbers can clearly tell you what proportion of reads map to What gene in each sample and since RNA seek is all about comparing relative proportions of reads this metric seems more appropriate the end I hope this helps you understand the difference between these different metrics tune in next time for another exciting stat Quest
Original Description
A StatQuest http://statquest.org/ about RPKM, FPKM and TPM. These terms are for high-throughput RNA-seq experiments.
For a complete index of all the StatQuest videos, check out:
https://statquest.org/video-index/
If you'd like to support StatQuest, please consider...
Patreon: https://www.patreon.com/statquest
...or...
YouTube Membership: https://www.youtube.com/channel/UCtYLUTtgS3k1Fg4y5tAhLbw/join
...buying one of my books, a study guide, a t-shirt or hoodie, or a song from the StatQuest store...
https://statquest.org/statquest-store/
...or just donating to StatQuest!
https://www.paypal.me/statquest
#statquest #rnaseq #rpkm
Watch on YouTube ↗
(saves to browser)
Sign in to unlock AI tutor explanation · ⚡30
Playlist
Uploads from StatQuest with Josh Starmer · StatQuest with Josh Starmer · 9 of 60
1
 2
2
 3
3
 4
4
 5
5
 6
6
 7
7
 8
8
 ▶
▶
 10
10
 11
11
 12
12
 13
13
 14
14
 15
15
 16
16
 17
17
 18
18
 19
19
 20
20
 21
21
 22
22
 23
23
 24
24
 25
25
 26
26
 27
27
 28
28
 29
29
 30
30
 31
31
 32
32
 33
33
 34
34
 35
35
 36
36
 37
37
 38
38
 39
39
 40
40
 41
41
 42
42
 43
43
 44
44
 45
45
 46
46
 47
47
 48
48
 49
49
 50
50
 51
51
 52
52
 53
53
 54
54
 55
55
 56
56
 57
57
 58
58
 59
59
 60
60

Cutting Butter
StatQuest with Josh Starmer
onion-dice
StatQuest with Josh Starmer
R-squared, Clearly Explained!!!
StatQuest with Josh Starmer
Wrapping up dumplings for pot stickers.
StatQuest with Josh Starmer
The standard error, Clearly Explained!!!
StatQuest with Josh Starmer
That Dude (in the movies)
StatQuest with Josh Starmer
How to puree garlic
StatQuest with Josh Starmer
Confidence Intervals, Clearly Explained!!!
StatQuest with Josh Starmer
RPKM, FPKM and TPM, Clearly Explained!!!
StatQuest with Josh Starmer
Principal Component Analysis (PCA) clearly explained (2015)
StatQuest with Josh Starmer
StatQuest: RNA-seq - the problem with technical replicates
StatQuest with Josh Starmer
That's Alright
StatQuest with Josh Starmer
Christmas In Rio! (now on iTunes!)
StatQuest with Josh Starmer
Drawing and Interpreting Heatmaps
StatQuest with Josh Starmer
Rachel's Song (the ballad of Hazel Motes)
StatQuest with Josh Starmer
Deal With It
StatQuest with Josh Starmer
Say Your Goodbyes
StatQuest with Josh Starmer
Another Day
StatQuest with Josh Starmer
StatQuest: Linear Discriminant Analysis (LDA) clearly explained.
StatQuest with Josh Starmer
Maybe It'll Go Away
StatQuest with Josh Starmer
Nasty Weather
StatQuest with Josh Starmer
Roses
StatQuest with Josh Starmer
p-hacking and power calculations
StatQuest with Josh Starmer
I Love You
StatQuest with Josh Starmer
The Coldest Day of the Year
StatQuest with Josh Starmer
Psycho Killer
StatQuest with Josh Starmer
False Discovery Rates, FDR, clearly explained
StatQuest with Josh Starmer
A New Song
StatQuest with Josh Starmer
StatQuickie: Thresholds for Significance
StatQuest with Josh Starmer
Logs (logarithms), Clearly Explained!!!
StatQuest with Josh Starmer
Bar Charts Are Better than Pie Charts
StatQuest with Josh Starmer
Mr Hattie
StatQuest with Josh Starmer
StatQuickie: Which t test to use
StatQuest with Josh Starmer
Fisher's Exact Test and the Hypergeometric Distribution
StatQuest with Josh Starmer
Standard Deviation vs Standard Error, Clearly Explained!!!
StatQuest with Josh Starmer
StatQuest: DESeq2, part 1, Library Normalization
StatQuest with Josh Starmer
The Rainbow
StatQuest with Josh Starmer
StatQuest: edgeR, part 1, Library Normalization
StatQuest with Josh Starmer
The Main Ideas behind Probability Distributions
StatQuest with Josh Starmer
StatQuest: One or Two Tailed P-Values
StatQuest with Josh Starmer
Evil Genius
StatQuest with Josh Starmer
Sampling from a Distribution, Clearly Explained!!!
StatQuest with Josh Starmer
StatQuest: edgeR and DESeq2, part 2 - Independent Filtering
StatQuest with Josh Starmer
The Main Ideas of Fitting a Line to Data (The Main Ideas of Least Squares and Linear Regression.)
StatQuest with Josh Starmer
The Sum of Regrets
StatQuest with Josh Starmer
Lowess and Loess, Clearly Explained!!!
StatQuest with Josh Starmer
StatQuest: Hierarchical Clustering
StatQuest with Josh Starmer
StatQuest: K-nearest neighbors, Clearly Explained
StatQuest with Josh Starmer
Your Dark Side
StatQuest with Josh Starmer
Boxplots are Awesome!!!
StatQuest with Josh Starmer
What is a (mathematical) model?
StatQuest with Josh Starmer
Linear Regression, Clearly Explained!!!
StatQuest with Josh Starmer
Linear Regression in R, Step-by-Step
StatQuest with Josh Starmer
Maximum Likelihood, clearly explained!!!
StatQuest with Josh Starmer
Brothers
StatQuest with Josh Starmer
Using Linear Models for t-tests and ANOVA, Clearly Explained!!!
StatQuest with Josh Starmer
StatQuest: How to make a Mean Pizza Crust!!!
StatQuest with Josh Starmer
StatQuest: A gentle introduction to RNA-seq
StatQuest with Josh Starmer
I'm Alive
StatQuest with Josh Starmer
StatQuest: t-SNE, Clearly Explained
StatQuest with Josh Starmer
More on: Reading ML Papers
View skill →


Related AI Lessons
⚡
⚡
⚡
⚡
I Spent Weeks Looking for a Research Gap Before I Realized I Was Searching the Wrong Way
Medium · AI
ICMI 2026 Reviews [D]
Reddit r/MachineLearning
Workshop submission for main conference paper under review [D]
Reddit r/MachineLearning
Kept context-switching between arxiv, OpenReview, GitHub, and HuggingFace for every paper, so I built this. Chrome extension + website with everything inline, plus citation graph + SPECTER2 neighbors. 3M papers, free, feedback welcome [P]
Reddit r/MachineLearning
🎓
Tutor Explanation