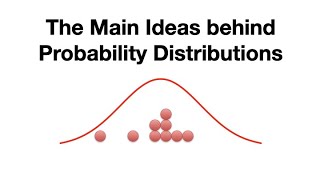
The Main Ideas behind Probability Distributions
Skills:
Probability & Statistics90%
Key Takeaways
The video explains the concept of probability distributions using histograms and curves, with a focus on understanding how measurements are distributed and how to approximate probabilities using curves.
Full Transcript
[Music] sted quizzed sted quest Stan West step quest stat quest hello and welcome to stat quest stat quest is brought to you by the friendly folks in the genetics department at the University of North Carolina at Chapel Hill today we're going to be talking about what a distribution is imagine you're at a wild and crazy dance party and you overhear someone talking about statistics chances are they're going to be talking about distributions Dagg what is a statistical distribution imagine we measured the height of a lot of people the first person we measured was 5.2 feet tall so we put that measurement in a bin that spans from five feet to 5.5 feet the second person we measured was five point eight feet tall the third person we measured was five point six feet tall the fourth person we measured was 5.9 feet tall the fifth person we measured was only 5.1 feet tall and the sixth person we measured with 6.3 feet tall okay you get the idea we measure a bunch of people and put the measurements in bins when you stack a bunch of measurements in two bins like this you get a histogram most of the measurements come from people between five and six feet tall people smaller than five feet tall were relatively rare people taller than six feet tall were also relatively rare in other words if you picked one measurement at random there's a good chance it would be between five and six feet tall the histogram gives us a sense of how likely will measure someone really tall or really short or closer to the average what if we use smaller bin sizes for our measurements now the bends are half as wide as before and here's how our data stacks up in the smaller bends again most measurements are between five and six feet tall but we can be more precise and say half the people are between five point to five feet tall and five point seven five feet tall by measuring more people and using smaller bins we get a more accurate and more precise estimate of how Heights are distributed we can use a curve to approximate the histogram the curve tells us the same thing that the histogram tells us there's a low probability that we will measure someone shorter than five feet tall there's a low probability that we will measure someone taller than six feet lastly there's a relatively high probability will measure someone between five and six feet tall however the curve has a few advantages over the histogram first even though we measured a bunch of people we didn't get a value for this bin since we can't calculate that probability with the histogram does that mean we will never get a measurement that fits into that bin no instead we can use the curve to calculate the probability another advantage is that the curve is not limited by the width of the bins if we wanted to know the probability of measuring someone between five point zero to one and five point three one seven we could use calculus or a computer to calculate this without having to round to the nearest bin size lastly if we don't have enough time or money to get a ton of measurements the approximate curve based on the mean and standard deviation of the data that we were able to collect is usually good enough thus using the curve can save us a lot of time and money both the histogram and the curve our distributions they show us how the probabilities of measurements are distributed the tallest part of the histogram or curve shows the region where measurements are most likely the low parts of the histogram or curve show where measurements are less likely we've been talking about how height measurements are distributed but there are all kinds of distributions with all kinds of interesting shapes we'll talk about these in future stat quests the end tune in next time for another exciting stat quest
Original Description
Here we demystify what a probability distribution is. It's not complicated, and we'll build on this in the coming weeks.
For a complete index of all the StatQuest videos, check out:
https://statquest.org/video-index/
If you'd like to support StatQuest, please consider...
Patreon: https://www.patreon.com/statquest
...or...
YouTube Membership: https://www.youtube.com/channel/UCtYLUTtgS3k1Fg4y5tAhLbw/join
...buying one of my books, a study guide, a t-shirt or hoodie, or a song from the StatQuest store...
https://statquest.org/statquest-store/
...or just donating to StatQuest!
https://www.paypal.me/statquest
Lastly, if you want to keep up with me as I research and create new StatQuests, follow me on twitter:
https://twitter.com/joshuastarmer
#statquest #statistics
Watch on YouTube ↗
(saves to browser)
Sign in to unlock AI tutor explanation · ⚡30
Playlist
Uploads from StatQuest with Josh Starmer · StatQuest with Josh Starmer · 39 of 60
1
 2
2
 3
3
 4
4
 5
5
 6
6
 7
7
 8
8
 9
9
 10
10
 11
11
 12
12
 13
13
 14
14
 15
15
 16
16
 17
17
 18
18
 19
19
 20
20
 21
21
 22
22
 23
23
 24
24
 25
25
 26
26
 27
27
 28
28
 29
29
 30
30
 31
31
 32
32
 33
33
 34
34
 35
35
 36
36
 37
37
 38
38
 ▶
▶
 40
40
 41
41
 42
42
 43
43
 44
44
 45
45
 46
46
 47
47
 48
48
 49
49
 50
50
 51
51
 52
52
 53
53
 54
54
 55
55
 56
56
 57
57
 58
58
 59
59
 60
60
Cutting Butter
StatQuest with Josh Starmer
onion-dice
StatQuest with Josh Starmer
R-squared, Clearly Explained!!!
StatQuest with Josh Starmer
Wrapping up dumplings for pot stickers.
StatQuest with Josh Starmer
The standard error, Clearly Explained!!!
StatQuest with Josh Starmer
That Dude (in the movies)
StatQuest with Josh Starmer
How to puree garlic
StatQuest with Josh Starmer
Confidence Intervals, Clearly Explained!!!
StatQuest with Josh Starmer
RPKM, FPKM and TPM, Clearly Explained!!!
StatQuest with Josh Starmer
Principal Component Analysis (PCA) clearly explained (2015)
StatQuest with Josh Starmer
StatQuest: RNA-seq - the problem with technical replicates
StatQuest with Josh Starmer
That's Alright
StatQuest with Josh Starmer
Christmas In Rio! (now on iTunes!)
StatQuest with Josh Starmer
Drawing and Interpreting Heatmaps
StatQuest with Josh Starmer
Rachel's Song (the ballad of Hazel Motes)
StatQuest with Josh Starmer
Deal With It
StatQuest with Josh Starmer
Say Your Goodbyes
StatQuest with Josh Starmer
Another Day
StatQuest with Josh Starmer
StatQuest: Linear Discriminant Analysis (LDA) clearly explained.
StatQuest with Josh Starmer
Maybe It'll Go Away
StatQuest with Josh Starmer
Nasty Weather
StatQuest with Josh Starmer
Roses
StatQuest with Josh Starmer
p-hacking and power calculations
StatQuest with Josh Starmer
I Love You
StatQuest with Josh Starmer
The Coldest Day of the Year
StatQuest with Josh Starmer
Psycho Killer
StatQuest with Josh Starmer
False Discovery Rates, FDR, clearly explained
StatQuest with Josh Starmer
A New Song
StatQuest with Josh Starmer
StatQuickie: Thresholds for Significance
StatQuest with Josh Starmer
Logs (logarithms), Clearly Explained!!!
StatQuest with Josh Starmer
Bar Charts Are Better than Pie Charts
StatQuest with Josh Starmer
Mr Hattie
StatQuest with Josh Starmer
StatQuickie: Which t test to use
StatQuest with Josh Starmer
Fisher's Exact Test and the Hypergeometric Distribution
StatQuest with Josh Starmer
Standard Deviation vs Standard Error, Clearly Explained!!!
StatQuest with Josh Starmer
StatQuest: DESeq2, part 1, Library Normalization
StatQuest with Josh Starmer
The Rainbow
StatQuest with Josh Starmer
StatQuest: edgeR, part 1, Library Normalization
StatQuest with Josh Starmer
The Main Ideas behind Probability Distributions
StatQuest with Josh Starmer
StatQuest: One or Two Tailed P-Values
StatQuest with Josh Starmer
Evil Genius
StatQuest with Josh Starmer
Sampling from a Distribution, Clearly Explained!!!
StatQuest with Josh Starmer
StatQuest: edgeR and DESeq2, part 2 - Independent Filtering
StatQuest with Josh Starmer
The Main Ideas of Fitting a Line to Data (The Main Ideas of Least Squares and Linear Regression.)
StatQuest with Josh Starmer
The Sum of Regrets
StatQuest with Josh Starmer
Lowess and Loess, Clearly Explained!!!
StatQuest with Josh Starmer
StatQuest: Hierarchical Clustering
StatQuest with Josh Starmer
StatQuest: K-nearest neighbors, Clearly Explained
StatQuest with Josh Starmer
Your Dark Side
StatQuest with Josh Starmer
Boxplots are Awesome!!!
StatQuest with Josh Starmer
What is a (mathematical) model?
StatQuest with Josh Starmer
Linear Regression, Clearly Explained!!!
StatQuest with Josh Starmer
Linear Regression in R, Step-by-Step
StatQuest with Josh Starmer
Maximum Likelihood, clearly explained!!!
StatQuest with Josh Starmer
Brothers
StatQuest with Josh Starmer
Using Linear Models for t-tests and ANOVA, Clearly Explained!!!
StatQuest with Josh Starmer
StatQuest: How to make a Mean Pizza Crust!!!
StatQuest with Josh Starmer
StatQuest: A gentle introduction to RNA-seq
StatQuest with Josh Starmer
I'm Alive
StatQuest with Josh Starmer
StatQuest: t-SNE, Clearly Explained
StatQuest with Josh Starmer
More on: Probability & Statistics
View skill →



🎓
Tutor Explanation

 DeepCamp AI