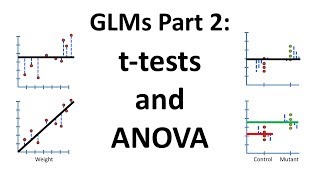
StatQuickie: Which t test to use
Key Takeaways
The video discusses the different types of t-tests, including paired and unpaired t-tests, and when to use them, as well as the choice between one-tailed and two-tailed t-tests, with a recommendation to use two-tailed t-tests that do not assume equal variance for unpaired data.
Full Transcript
hello and welcome to a stat quickie on t-tests I work in a large genetics lab and people often ask me questions about T tests the first question they ask me is what type of T tests they should use there are two main categories for T tests paired and unpaired pair T tests are useful when you have before and after measurements taken from the same test subject for example if you have a drug for blood pressure say like you take a group of people and you measure their blood pressure and then you give them this drug and then after they've taken the drug you test their breath you test their blood pressure again so for each person in the study each individual you have a pair of measurements you have a before measurement and then you have an after measurement and so when you have data like that that's paired used a paired t-test when you don't have paired data for example say like you have a one group of people and you measure their height and we call that group a and then we have another group of people and we measure their height and we croc when we call that group B then we have unpaired data and so that's when you use an unpaired t-test and there are two subcategories of unpaired T tests one assumes that the variance within each group so the variation around the height measurements in Group A is the exact same as the variation around the height measurements in Group B so they call that a well actually I don't know what they call that they call that a t-test that assumes equal variation or equal variance there's another type of t-test that does not assume equal variation so you could have a different measurement of variance in Group A as opposed to group B now I often recommend that people select the test that does not assume that the variation is equal in both groups simply because that test is slightly more conservative and if your data can pass this more conservative t-test then you know your data are rock solid so I think that's my general recommendation for using t-test you go with if you have unpaired data go with the test that does not assume equal variance in both groups okay now the second question people ask me is should they use a one-tailed or one sided T test or a two-tailed or two sided t-test now a two-sided T tests say for example we'll go back to our height measurements so we have Group A and Group B and we've measured the heights in both groups a two-tailed t-test would test to see if group a is higher than group B and it also tests to see if it's significantly smaller than Group B so it tests both sides it tests two conditions so you've got a tail up here and you've got a tail down here um it's it's agnostic to the data it doesn't have some preconceived notion that group a should be taller or group a should be smaller it says I'm going to test both sides and just see what group a is a one tailed t-test is a lot less conservative because it it requires you to say oh I know which direction a is gonna be a is has to be higher than B and generally speaking in academic journals that's not a good way to go generally speaking you want the data to speak for itself and that's why I always recommend people use two-sided t-test because it's slightly more conservative and it lets the data speak for itself and again the conservative thing means you've got rock silence rock solid data so in summary if you've got paired data meaning you've got a single you've got subjects and for each subject you've got two measurements you've got a before and an F Oh Oh then use a pair of t-test but if you don't have paired data so you've got to group two separate groups of people you've measured everything and there's and there's not overlap between who's and which group so if you've got unpaired data use an unpaired t-test and try not to assume equal variance because that'll make the test more conservative and use a two teeth two-tailed t-test because that makes the data speak for itself and again it makes it a little more conservative so if your data can pass that test you know it's rock-solid all right that's all there is to it thanks so much for paying attention to this stack quickie auntie Tess
Original Description
tl;dw - unless you've got paired data (explained in the video) use a two-tailed t-test that does not assume equal variance. This is the most conservative, and if you can show significance, you know your data is rock solid.
In MS Excel, this means setting "Tails = 2" and "Type = 3".
For a complete index of all the StatQuest videos, check out:
https://statquest.org/video-index/
If you'd like to support StatQuest, please consider...
Patreon: https://www.patreon.com/statquest
...or...
YouTube Membership: https://www.youtube.com/channel/UCtYLUTtgS3k1Fg4y5tAhLbw/join
...buying one of my books, a study guide, a t-shirt or hoodie, or a song from the StatQuest store...
https://statquest.org/statquest-store/
...or just donating to StatQuest!
https://www.paypal.me/statquest
Lastly, if you want to keep up with me as I research and create new StatQuests, follow me on twitter:
https://twitter.com/joshuastarmer
Watch on YouTube ↗
(saves to browser)
Sign in to unlock AI tutor explanation · ⚡30
Playlist
Uploads from StatQuest with Josh Starmer · StatQuest with Josh Starmer · 33 of 60
1
 2
2
 3
3
 4
4
 5
5
 6
6
 7
7
 8
8
 9
9
 10
10
 11
11
 12
12
 13
13
 14
14
 15
15
 16
16
 17
17
 18
18
 19
19
 20
20
 21
21
 22
22
 23
23
 24
24
 25
25
 26
26
 27
27
 28
28
 29
29
 30
30
 31
31
 32
32
 ▶
▶
 34
34
 35
35
 36
36
 37
37
 38
38
 39
39
 40
40
 41
41
 42
42
 43
43
 44
44
 45
45
 46
46
 47
47
 48
48
 49
49
 50
50
 51
51
 52
52
 53
53
 54
54
 55
55
 56
56
 57
57
 58
58
 59
59
 60
60

Cutting Butter
StatQuest with Josh Starmer
onion-dice
StatQuest with Josh Starmer
R-squared, Clearly Explained!!!
StatQuest with Josh Starmer
Wrapping up dumplings for pot stickers.
StatQuest with Josh Starmer
The standard error, Clearly Explained!!!
StatQuest with Josh Starmer
That Dude (in the movies)
StatQuest with Josh Starmer
How to puree garlic
StatQuest with Josh Starmer
Confidence Intervals, Clearly Explained!!!
StatQuest with Josh Starmer
RPKM, FPKM and TPM, Clearly Explained!!!
StatQuest with Josh Starmer
Principal Component Analysis (PCA) clearly explained (2015)
StatQuest with Josh Starmer
StatQuest: RNA-seq - the problem with technical replicates
StatQuest with Josh Starmer
That's Alright
StatQuest with Josh Starmer
Christmas In Rio! (now on iTunes!)
StatQuest with Josh Starmer
Drawing and Interpreting Heatmaps
StatQuest with Josh Starmer
Rachel's Song (the ballad of Hazel Motes)
StatQuest with Josh Starmer
Deal With It
StatQuest with Josh Starmer
Say Your Goodbyes
StatQuest with Josh Starmer
Another Day
StatQuest with Josh Starmer
StatQuest: Linear Discriminant Analysis (LDA) clearly explained.
StatQuest with Josh Starmer
Maybe It'll Go Away
StatQuest with Josh Starmer
Nasty Weather
StatQuest with Josh Starmer
Roses
StatQuest with Josh Starmer
p-hacking and power calculations
StatQuest with Josh Starmer
I Love You
StatQuest with Josh Starmer
The Coldest Day of the Year
StatQuest with Josh Starmer
Psycho Killer
StatQuest with Josh Starmer
False Discovery Rates, FDR, clearly explained
StatQuest with Josh Starmer
A New Song
StatQuest with Josh Starmer
StatQuickie: Thresholds for Significance
StatQuest with Josh Starmer
Logs (logarithms), Clearly Explained!!!
StatQuest with Josh Starmer
Bar Charts Are Better than Pie Charts
StatQuest with Josh Starmer
Mr Hattie
StatQuest with Josh Starmer
StatQuickie: Which t test to use
StatQuest with Josh Starmer
Fisher's Exact Test and the Hypergeometric Distribution
StatQuest with Josh Starmer
Standard Deviation vs Standard Error, Clearly Explained!!!
StatQuest with Josh Starmer
StatQuest: DESeq2, part 1, Library Normalization
StatQuest with Josh Starmer
The Rainbow
StatQuest with Josh Starmer
StatQuest: edgeR, part 1, Library Normalization
StatQuest with Josh Starmer
The Main Ideas behind Probability Distributions
StatQuest with Josh Starmer
StatQuest: One or Two Tailed P-Values
StatQuest with Josh Starmer
Evil Genius
StatQuest with Josh Starmer
Sampling from a Distribution, Clearly Explained!!!
StatQuest with Josh Starmer
StatQuest: edgeR and DESeq2, part 2 - Independent Filtering
StatQuest with Josh Starmer
The Main Ideas of Fitting a Line to Data (The Main Ideas of Least Squares and Linear Regression.)
StatQuest with Josh Starmer
The Sum of Regrets
StatQuest with Josh Starmer
Lowess and Loess, Clearly Explained!!!
StatQuest with Josh Starmer
StatQuest: Hierarchical Clustering
StatQuest with Josh Starmer
StatQuest: K-nearest neighbors, Clearly Explained
StatQuest with Josh Starmer
Your Dark Side
StatQuest with Josh Starmer
Boxplots are Awesome!!!
StatQuest with Josh Starmer
What is a (mathematical) model?
StatQuest with Josh Starmer
Linear Regression, Clearly Explained!!!
StatQuest with Josh Starmer
Linear Regression in R, Step-by-Step
StatQuest with Josh Starmer
Maximum Likelihood, clearly explained!!!
StatQuest with Josh Starmer
Brothers
StatQuest with Josh Starmer
Using Linear Models for t-tests and ANOVA, Clearly Explained!!!
StatQuest with Josh Starmer
StatQuest: How to make a Mean Pizza Crust!!!
StatQuest with Josh Starmer
StatQuest: A gentle introduction to RNA-seq
StatQuest with Josh Starmer
I'm Alive
StatQuest with Josh Starmer
StatQuest: t-SNE, Clearly Explained
StatQuest with Josh Starmer
More on: Research Methods
View skill →


Related AI Lessons
⚡
⚡
⚡
⚡
I Spent Weeks Looking for a Research Gap Before I Realized I Was Searching the Wrong Way
Medium · AI
ICMI 2026 Reviews [D]
Reddit r/MachineLearning
Workshop submission for main conference paper under review [D]
Reddit r/MachineLearning
Kept context-switching between arxiv, OpenReview, GitHub, and HuggingFace for every paper, so I built this. Chrome extension + website with everything inline, plus citation graph + SPECTER2 neighbors. 3M papers, free, feedback welcome [P]
Reddit r/MachineLearning
🎓
Tutor Explanation