StatQuest: Hierarchical Clustering
Key Takeaways
The video demonstrates hierarchical clustering, a technique used to order rows and columns based on similarity, often used with heatmaps and machine learning, and explains the process of determining similarity using distance metrics such as Euclidean distance and UKian distance.
Full Transcript
[Music] going on a quest on a stat Quest stat Quest hello and welcome to stat Quest today we're going to be talking about hierarchical clustering hierarchical clustering is often associated with heat Maps if you're not already familiar with what heat maps are just know that the columns typically represent different samples and that the rows typically represent measurements from different genes red typically signifies High expression of a gene and blue or purple means lower expression for a gene hierarchical clustering orders the rows and or the columns based on similarity this makes it easy to see correlation in the data for example these samples express the same genes and these genes behave the same on the left we have a heat map without hierarchical clustering and on the right we have a heat map with hierarchical clustering so you can see that the clustering makes a big difference on how the data is presented heat Maps often come with dendrograms so we'll talk about those too let's get started we'll start with a simple example here we've got a simple heat map that has three samples and four genes for this example we are just going to Cluster or reorder the rows or the genes conceptually the first step is to figure out which Gene is most similar to Gene number one genes number one and two are different we can tell because the colors are very different Gene one is highly expressed in Sample number one so it has a red color Gene 2 however is not highly expressed on Sample number one so it has a blue color in Sample number three Gene one is lowly expressed so it's blue and Gene 2 is highly expressed so it's red genes 1 and three are similar so that means in Sample one both Gene 1 and three are red they're highly expressed and in Sample three they're both blue meaning they're lowly expressed genes one and four are also similar however Gene number one is most similar to Gene number three so the second step is to figure out what Gene is most similar to Gene number two so we do all the comparisons and we see that Gene number two is most similar to Gene number four and then we do the same thing for Gene number three and then Gene number four in Step number three we look at the different combinations and figure out which two genes are the most similar once we've done that we merge them into a cluster in this case genes number one and three are more similar than any other combination of genes so genes 1 and three are now cluster number one step four go back to step one but now treat the new cluster like it's a single Gene so in step one we figure out which Gene is most similar to Cluster number one cluster number one is most similar to Gene number four and we figure out which Gene is most similar to Gene number two in this case Gene number two is most similar to Gene number four but notice that we compared Gene number two to Cluster number one and then we do the same thing for Gene number four of the different combinations figure out which two genes are the most similar now merge them into a cluster in this case genes 2 and four are the most similar combination so we've merged them into a cluster now we go back to Step One however since all we have left are two clusters we merge them bam we're all done hierarchical clustering is usually accompanied by a dendrogram it indicates both the similarity and the order that the Clusters were formed cluster number one was formed first and is is most similar it has the shortest Branch cluster number two was second and is the second most similar it has the second shortest Branch cluster number three which contains all of the genes was formed last it has the longest Branch now let's go over a few nitpicky details remember the first step figure out which Gene is most similar to Gene number one well we have to Define what most similar means the method for determining similarity is arbitrarily chosen however the ukian distance between genes is used a lot let's look at an example we'll use a very simple heat map that just has two samples and two genes now we're displaying the values that underly the the colors that we have in the heat map the ukian distance between genes 1 and two is just the square root of the difference in Sample number one squared plus the difference in Sample number two squared here we'll just plug in the values for sample number one we have 1.6 minus 0.5 now let's plug in the values to calculate the difference in Sample number two we have 0.5 minus -1.9 doing the subtraction gives us the square < TK of 2.12 + 2.4 2ar we can think of these values within the parentheses as sides on a triangle so on the x axis we have the distance between Gene 1 and Gene 2 in Sample number one and on the Y AIS we have the distance between Gene 1 1 and two in Sample number two the hypotenuse is the distance between genes 1 and two the Pythagorean theorem says that the hypotenuse equals theare < TK of x^2 + y^2 in this case that means the Square t of 2.12 + 2.4 SAR and that gives us 3.2 the distance between Gene number one and Gene number two when we have more samples we just extend the equation it's no big deal the ukian distance is just one method there are lots more including the Manhattan distance the Manhattan distance is just the absolute value of the differences so instead of squaring the differences and then taking the square root all we do is take the absolute value of the differences we can think of the Manhattan distance in geometric terms by imagining that each difference is a line segment if we take all those line segments and put them together head to tail head to tail and then add that total length of all those line segments together that's the Manhattan distance yes it makes a difference here's a heat map Drawn using the ukian distance and here's the same information drawn as a heat map but now we're using the Manhattan distance the heat maps are very similar but there are also a few differences the choice and distance metric is arbitrary W there is no biological or physical reason to choose one and not the other pick the one that gives you more insight into your data now do you remember how we merged genes 1 and three into cluster number one and compared it to other genes well there are different ways to compare clusters too one simple idea is to use the average of the measurements from each sample but there are lots more and these have effect on clustering as well so let's talk about the different ways to compare clusters for the sake of visualizing how the different methods work imagine our data was spread out on an XY plane now imagine that we have already formed these two clusters and we just want to figure out which cluster this last Point belongs to we can compare that point to the average of each cluster this is called the centroid the closest point in each cluster this is called single linkage or we can compare it to the furthest point in each cluster this is called complete linkage and there are other methods as well here's a heat map that compares the furthest points in the clusters by the way if you use R this is the default setting for the hclust function this heat map compares the average points in the Clusters and this last Heat Map compares the closest points in the Clusters these heat maps are all very similar but there are also differences in the way the data is presented in some summary clusters are formed based on some notion of similarity you have to decide what that is however most programs have reasonable defaults once you have a subcluster you have to decide how it should be compared to other rows columns or subclusters Etc and most programs have good default settings for this as well and the height of the branches in the Dinger gram shows you what is most simple similar hooray we've made it to the end of another exciting stat Quest if you liked this presentation please subscribe to my channel and you'll get more like it also if you'd like me to do something specific feel free to mention it in the comments below
Original Description
Hierarchical clustering is often used with heatmaps and with machine learning type stuff. It's no big deal, though, and based on just a few simple concepts. If you want to draw a heatmap using R, I've put some sample code on my webiste: https://statquest.org/statquest-hierarchical-clustering/
For a complete index of all the StatQuest videos, check out:
https://statquest.org/video-index/
If you'd like to support StatQuest, please consider...
Patreon: https://www.patreon.com/statquest
...or...
YouTube Membership: https://www.youtube.com/channel/UCtYLUTtgS3k1Fg4y5tAhLbw/join
...buying one of my books, a study guide, a t-shirt or hoodie, or a song from the StatQuest store...
https://statquest.org/statquest-store/
...or just donating to StatQuest!
https://www.paypal.me/statquest
Lastly, if you want to keep up with me as I research and create new StatQuests, follow me on twitter:
https://twitter.com/joshuastarmer
#statquest #ML #clustering
Watch on YouTube ↗
(saves to browser)
Sign in to unlock AI tutor explanation · ⚡30
Playlist
Uploads from StatQuest with Josh Starmer · StatQuest with Josh Starmer · 47 of 60
1
 2
2
 3
3
 4
4
 5
5
 6
6
 7
7
 8
8
 9
9
 10
10
 11
11
 12
12
 13
13
 14
14
 15
15
 16
16
 17
17
 18
18
 19
19
 20
20
 21
21
 22
22
 23
23
 24
24
 25
25
 26
26
 27
27
 28
28
 29
29
 30
30
 31
31
 32
32
 33
33
 34
34
 35
35
 36
36
 37
37
 38
38
 39
39
 40
40
 41
41
 42
42
 43
43
 44
44
 45
45
 46
46
 ▶
▶
 48
48
 49
49
 50
50
 51
51
 52
52
 53
53
 54
54
 55
55
 56
56
 57
57
 58
58
 59
59
 60
60

Cutting Butter
StatQuest with Josh Starmer
onion-dice
StatQuest with Josh Starmer
R-squared, Clearly Explained!!!
StatQuest with Josh Starmer
Wrapping up dumplings for pot stickers.
StatQuest with Josh Starmer
The standard error, Clearly Explained!!!
StatQuest with Josh Starmer
That Dude (in the movies)
StatQuest with Josh Starmer
How to puree garlic
StatQuest with Josh Starmer
Confidence Intervals, Clearly Explained!!!
StatQuest with Josh Starmer
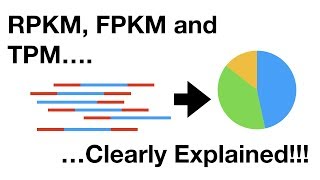
RPKM, FPKM and TPM, Clearly Explained!!!
StatQuest with Josh Starmer
Principal Component Analysis (PCA) clearly explained (2015)
StatQuest with Josh Starmer
StatQuest: RNA-seq - the problem with technical replicates
StatQuest with Josh Starmer
That's Alright
StatQuest with Josh Starmer
Christmas In Rio! (now on iTunes!)
StatQuest with Josh Starmer
Drawing and Interpreting Heatmaps
StatQuest with Josh Starmer
Rachel's Song (the ballad of Hazel Motes)
StatQuest with Josh Starmer
Deal With It
StatQuest with Josh Starmer
Say Your Goodbyes
StatQuest with Josh Starmer
Another Day
StatQuest with Josh Starmer
StatQuest: Linear Discriminant Analysis (LDA) clearly explained.
StatQuest with Josh Starmer
Maybe It'll Go Away
StatQuest with Josh Starmer
Nasty Weather
StatQuest with Josh Starmer
Roses
StatQuest with Josh Starmer
p-hacking and power calculations
StatQuest with Josh Starmer
I Love You
StatQuest with Josh Starmer
The Coldest Day of the Year
StatQuest with Josh Starmer
Psycho Killer
StatQuest with Josh Starmer
False Discovery Rates, FDR, clearly explained
StatQuest with Josh Starmer
A New Song
StatQuest with Josh Starmer
StatQuickie: Thresholds for Significance
StatQuest with Josh Starmer
Logs (logarithms), Clearly Explained!!!
StatQuest with Josh Starmer
Bar Charts Are Better than Pie Charts
StatQuest with Josh Starmer
Mr Hattie
StatQuest with Josh Starmer
StatQuickie: Which t test to use
StatQuest with Josh Starmer
Fisher's Exact Test and the Hypergeometric Distribution
StatQuest with Josh Starmer
Standard Deviation vs Standard Error, Clearly Explained!!!
StatQuest with Josh Starmer
StatQuest: DESeq2, part 1, Library Normalization
StatQuest with Josh Starmer
The Rainbow
StatQuest with Josh Starmer
StatQuest: edgeR, part 1, Library Normalization
StatQuest with Josh Starmer
The Main Ideas behind Probability Distributions
StatQuest with Josh Starmer
StatQuest: One or Two Tailed P-Values
StatQuest with Josh Starmer
Evil Genius
StatQuest with Josh Starmer
Sampling from a Distribution, Clearly Explained!!!
StatQuest with Josh Starmer
StatQuest: edgeR and DESeq2, part 2 - Independent Filtering
StatQuest with Josh Starmer
The Main Ideas of Fitting a Line to Data (The Main Ideas of Least Squares and Linear Regression.)
StatQuest with Josh Starmer
The Sum of Regrets
StatQuest with Josh Starmer
Lowess and Loess, Clearly Explained!!!
StatQuest with Josh Starmer
StatQuest: Hierarchical Clustering
StatQuest with Josh Starmer
StatQuest: K-nearest neighbors, Clearly Explained
StatQuest with Josh Starmer
Your Dark Side
StatQuest with Josh Starmer
Boxplots are Awesome!!!
StatQuest with Josh Starmer
What is a (mathematical) model?
StatQuest with Josh Starmer
Linear Regression, Clearly Explained!!!
StatQuest with Josh Starmer
Linear Regression in R, Step-by-Step
StatQuest with Josh Starmer
Maximum Likelihood, clearly explained!!!
StatQuest with Josh Starmer
Brothers
StatQuest with Josh Starmer
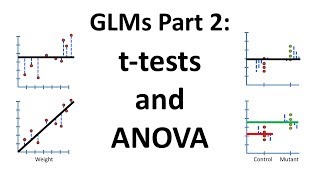
Using Linear Models for t-tests and ANOVA, Clearly Explained!!!
StatQuest with Josh Starmer
StatQuest: How to make a Mean Pizza Crust!!!
StatQuest with Josh Starmer
StatQuest: A gentle introduction to RNA-seq
StatQuest with Josh Starmer
I'm Alive
StatQuest with Josh Starmer
StatQuest: t-SNE, Clearly Explained
StatQuest with Josh Starmer
More on: ML Maths Basics
View skill →


Related AI Lessons
⚡
⚡
⚡
⚡
Data Preprocessing: Encoding and Feature Scaling in Machine Learning
Medium · Machine Learning
Data Preprocessing: Encoding and Feature Scaling in Machine Learning
Medium · Data Science
Data Preprocessing: Encoding and Feature Scaling in Machine Learning
Medium · Python
The Python Dictionary Trick That Makes Interviewers Smile
Dev.to · Ameer Abdullah
🎓
Tutor Explanation