StatQuest: K-nearest neighbors, Clearly Explained
Key Takeaways
The video explains the K-nearest neighbors algorithm, a simple and effective method for classifying data, using examples with PCA and hierarchical clustering.
Full Transcript
[Music] St Quest St Quest stack Quest hello and welcome to stack Quest stack Quest is brought to you by the friendly folks in the genetics department at the University of North Carolina at Chapel Hill today we're going to be talking about the K nearest neighbors algorithm which is a super simple way to classify data in a nutshell if you already had a lot of data that Define these cell types we could use it to decide which type of cell this guy is let's see it in action step one start with a data set with known categories in this case we have different cell types from an intestinal tumor we then cluster that data in this case we used PCA step two add a new cell with unknown category to the plot we don't know this cell's category because it was taken from another tumor where the cells were not properly sorted and so what we want to do is we want to classify this new cell we want to figure out what cell it's most similar to and then we're going to call it that type of cell step three we classify the new cell by looking at the nearest nearest annotated cells I.E the nearest neighbors if the K in K nearest neighbors is equal to one then we will only use the nearest neighbor to define the category in this case the category is green because the nearest neighbor is already known to be the green cell type if k equals 11 we would use the 11 nearest Neighbors in this case the category is still green because the 11 cells that are closest to the unknown cell are already green now the new cell is somewhere more interesting it's about halfway between the green and the red cells if k equals 11 and the new cells between two or more categories we simply pick the category that gets the most votes in this case seven nearest neighbors are red three nearest neighbors are orange one nearest neighbor is green since red got the most votes the final assignment is red this same principle applies to heat Maps this heat map was drawn with the same data and clustered using hierarchical clustering if our new cell ended up in the middle of the light blue cluster and if k equals 1 we just look at the nearest cell and that cell is light blue so we classify the unknown cell as a light blue cell if k equals 5 we'd look at the five nearest cells which are also light blue so we'd still classify the unknown cell as light blue if the new cell ended up closer to the edge of the light blue cells and k equals 11 then we take a vote seven nearest neighbors are light blue and four are light green so we'd still go with light blue if the new cell is right between two categories well if K is odd then we can avoid a lot of ties if we still get a tied vote we can flip a coin or decide not to assign the cell to a category before we go let's talk about a little machine learning SL data mining terminology the data used for the initial clustering the data where we know the categories in advance is called training data bam a few thoughts on picking a value for K there is no physical or biological way to determine the best value for K so you may have to try out a few values before settling on one do this by pretending part of the training data is unknown and then what you do is you categorize that unknown data using the K nearest neighbor algorithm and you assess how good the new categories match what you know already low values for K like k equal 1 or k equals 2 can be noisy and subject to the effects of outliers large values for K smooth over things but you don't want K to be so large that a c category with only a few samples in it will always be outvoted by other categories hooray we've made it to the end of another exciting stack Quest if you like this stack Quest go ahead and subscribe to my channel and you'll see more like it and if you have any ideas of things you'd like me to do a stack Quest on feel free to put those ideas in the comments okay guess that's it tune in next time for another exciting stag Quest
Original Description
Machine learning and Data Mining sure sound like complicated things, but that isn't always the case. Here we talk about the surprisingly simple and surprisingly effective K-nearest neighbors algorithm.
For a complete index of all the StatQuest videos, check out:
https://statquest.org/video-index/
If you'd like to support StatQuest, please consider...
Patreon: https://www.patreon.com/statquest
...or...
YouTube Membership: https://www.youtube.com/channel/UCtYLUTtgS3k1Fg4y5tAhLbw/join
...buying one of my books, a study guide, a t-shirt or hoodie, or a song from the StatQuest store...
https://statquest.org/statquest-store/
...or just donating to StatQuest!
https://www.paypal.me/statquest
Lastly, if you want to keep up with me as I research and create new StatQuests, follow me on twitter:
https://twitter.com/joshuastarmer
0:00 Awesome song and introduction
0:21 K-NN overview
0:44 K-NN applied to scatterplot data
2:44 K-NN applied to a heatmap
4:12 Thoughts on how to pick 'K'
#statquest #KNN #ML
Watch on YouTube ↗
(saves to browser)
Sign in to unlock AI tutor explanation · ⚡30
Playlist
Uploads from StatQuest with Josh Starmer · StatQuest with Josh Starmer · 48 of 60
1
 2
2
 3
3
 4
4
 5
5
 6
6
 7
7
 8
8
 9
9
 10
10
 11
11
 12
12
 13
13
 14
14
 15
15
 16
16
 17
17
 18
18
 19
19
 20
20
 21
21
 22
22
 23
23
 24
24
 25
25
 26
26
 27
27
 28
28
 29
29
 30
30
 31
31
 32
32
 33
33
 34
34
 35
35
 36
36
 37
37
 38
38
 39
39
 40
40
 41
41
 42
42
 43
43
 44
44
 45
45
 46
46
 47
47
 ▶
▶
 49
49
 50
50
 51
51
 52
52
 53
53
 54
54
 55
55
 56
56
 57
57
 58
58
 59
59
 60
60

Cutting Butter
StatQuest with Josh Starmer
onion-dice
StatQuest with Josh Starmer
R-squared, Clearly Explained!!!
StatQuest with Josh Starmer
Wrapping up dumplings for pot stickers.
StatQuest with Josh Starmer
The standard error, Clearly Explained!!!
StatQuest with Josh Starmer
That Dude (in the movies)
StatQuest with Josh Starmer
How to puree garlic
StatQuest with Josh Starmer
Confidence Intervals, Clearly Explained!!!
StatQuest with Josh Starmer
RPKM, FPKM and TPM, Clearly Explained!!!
StatQuest with Josh Starmer
Principal Component Analysis (PCA) clearly explained (2015)
StatQuest with Josh Starmer
StatQuest: RNA-seq - the problem with technical replicates
StatQuest with Josh Starmer
That's Alright
StatQuest with Josh Starmer
Christmas In Rio! (now on iTunes!)
StatQuest with Josh Starmer
Drawing and Interpreting Heatmaps
StatQuest with Josh Starmer
Rachel's Song (the ballad of Hazel Motes)
StatQuest with Josh Starmer
Deal With It
StatQuest with Josh Starmer
Say Your Goodbyes
StatQuest with Josh Starmer
Another Day
StatQuest with Josh Starmer
StatQuest: Linear Discriminant Analysis (LDA) clearly explained.
StatQuest with Josh Starmer
Maybe It'll Go Away
StatQuest with Josh Starmer
Nasty Weather
StatQuest with Josh Starmer
Roses
StatQuest with Josh Starmer
p-hacking and power calculations
StatQuest with Josh Starmer
I Love You
StatQuest with Josh Starmer
The Coldest Day of the Year
StatQuest with Josh Starmer
Psycho Killer
StatQuest with Josh Starmer
False Discovery Rates, FDR, clearly explained
StatQuest with Josh Starmer
A New Song
StatQuest with Josh Starmer
StatQuickie: Thresholds for Significance
StatQuest with Josh Starmer
Logs (logarithms), Clearly Explained!!!
StatQuest with Josh Starmer
Bar Charts Are Better than Pie Charts
StatQuest with Josh Starmer
Mr Hattie
StatQuest with Josh Starmer
StatQuickie: Which t test to use
StatQuest with Josh Starmer
Fisher's Exact Test and the Hypergeometric Distribution
StatQuest with Josh Starmer
Standard Deviation vs Standard Error, Clearly Explained!!!
StatQuest with Josh Starmer
StatQuest: DESeq2, part 1, Library Normalization
StatQuest with Josh Starmer
The Rainbow
StatQuest with Josh Starmer
StatQuest: edgeR, part 1, Library Normalization
StatQuest with Josh Starmer
The Main Ideas behind Probability Distributions
StatQuest with Josh Starmer
StatQuest: One or Two Tailed P-Values
StatQuest with Josh Starmer
Evil Genius
StatQuest with Josh Starmer
Sampling from a Distribution, Clearly Explained!!!
StatQuest with Josh Starmer
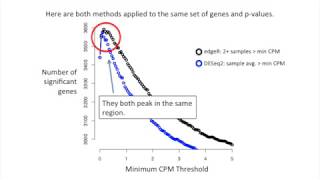
StatQuest: edgeR and DESeq2, part 2 - Independent Filtering
StatQuest with Josh Starmer
The Main Ideas of Fitting a Line to Data (The Main Ideas of Least Squares and Linear Regression.)
StatQuest with Josh Starmer
The Sum of Regrets
StatQuest with Josh Starmer
Lowess and Loess, Clearly Explained!!!
StatQuest with Josh Starmer
StatQuest: Hierarchical Clustering
StatQuest with Josh Starmer
StatQuest: K-nearest neighbors, Clearly Explained
StatQuest with Josh Starmer
Your Dark Side
StatQuest with Josh Starmer
Boxplots are Awesome!!!
StatQuest with Josh Starmer
What is a (mathematical) model?
StatQuest with Josh Starmer
Linear Regression, Clearly Explained!!!
StatQuest with Josh Starmer
Linear Regression in R, Step-by-Step
StatQuest with Josh Starmer
Maximum Likelihood, clearly explained!!!
StatQuest with Josh Starmer
Brothers
StatQuest with Josh Starmer
Using Linear Models for t-tests and ANOVA, Clearly Explained!!!
StatQuest with Josh Starmer
StatQuest: How to make a Mean Pizza Crust!!!
StatQuest with Josh Starmer
StatQuest: A gentle introduction to RNA-seq
StatQuest with Josh Starmer
I'm Alive
StatQuest with Josh Starmer
StatQuest: t-SNE, Clearly Explained
StatQuest with Josh Starmer
More on: Supervised Learning
View skill →


Related AI Lessons
⚡
⚡
⚡
⚡
I Spent Weeks Looking for a Research Gap Before I Realized I Was Searching the Wrong Way
Medium · AI
ICMI 2026 Reviews [D]
Reddit r/MachineLearning
Workshop submission for main conference paper under review [D]
Reddit r/MachineLearning
Kept context-switching between arxiv, OpenReview, GitHub, and HuggingFace for every paper, so I built this. Chrome extension + website with everything inline, plus citation graph + SPECTER2 neighbors. 3M papers, free, feedback welcome [P]
Reddit r/MachineLearning
Chapters (5)
Awesome song and introduction
0:21
K-NN overview
0:44
K-NN applied to scatterplot data
2:44
K-NN applied to a heatmap
4:12
Thoughts on how to pick 'K'
🎓
Tutor Explanation