Weaveworks is Bringing Horizontal Scaling to Prometheus
Skills:
Systems Design Basics60%
Key Takeaways
Weaveworks is bringing horizontal scaling to Prometheus with Cortex, a horizontally scalable version of Prometheus, designed to handle large-scale monitoring environments, utilizing tools such as AWS S3 and DynamoDB for long-term storage and structured data.
Full Transcript
[Music] thanks to Cisco for sponsoring our day of podcasting at Kubek on we had some great conversations thanks again to Cisco you can learn more about cisco and their micro services platform at mantle do that's ma n TL dot io hate Alex Williams the new stack here at Kubek on in Seattle it is day two and we are here with Matthew lodge if we work st. Matthew I likes good to see you good to see you enjoying by our colleague in podcasting Lee calcote solarwinds Haley I Matthew hey so Lee wrote one of our chapters and our ebook um monitoring actually uh you know did you wrote about prometheus along was it it was in wedding he booked Sur where was it again that's a good yeah yeah on it was ended up being a tutorial alright just you know about how to contribute to sort of what is prometheus it kinda how to how to crack open some of that code and contribute to it if you wanted to write and it looks like looks like some people are doing just that yes that's exactly what we do so so you guys are really embracing Prometheus Morty maybe you can tell us about you know what prometheus is just basically for folks and what it is is you're doing cuz I understand it's like kind of a horizontal scaling platform that's right that's what we're doing guess that's what we call cortex so Prometheus let's let's start there so engineers at soundcloud developed prometheus so they were ex-google guys and they were looking for a monitoring solution that was really going to work for containers and a much more dynamic environment there you know sort of traditional open source monitoring tools very much focused on monitoring servers and or virtual machines but they didn't map very well to highly dynamic containerized environments so for example a lot of monitoring tools couldn't keep track of where a container was you know its container gets dynamically scheduled and the monitoring tool just tells you about a particular host and then you have to go and find the container so the first thing you have to have to play the game you have to play is find the container so and because they come from google inside of Google they have this thing called Borg Martin or I used to have this thing called boardman and so they were you know they wanted something was more like that and so that's that's how Prometheus got started so Fabian and Julius or the main engineers over at SoundCloud and so we've been working very closely with Julius who's a independent contractor so if I be enjoying core OS and then Julia's been working very closely with us on cortex so when they when they built prometheus it's a single host solution rightly the idea is it goes out and it pulls all the metrics and pulls them into its time series database it's a multi-dimensional database and that's a mixed damage the crucial difference for running queries and troubleshooting very different again to other open source monitoring tools where it plays two dimensionally have a time series you have a value and a timestamp for value in a time term the problem then comes when you in a correlate all these things together and you say great well I want to know what are the names of all the containers between eight nine o'clock this morning that had CPU grade and ten percent and less than a gig of free memory now in a traditional monitoring system you have to go and Traverse all of those time series right and then try and join all that stuff back together in order to execute that query and so for a lot them you just can't run that query it's not possible but the nice thing about prometheus is that all of those data things are still together at the same time right so it's more like a cube or data cube on the back end so you can run these very complex queries so you can answer that question that queer i just gave you could do that with prometheus the drawback of prometheus is that everything's stored locally on disk right so yeah just write to the file system so we were all your stuff is seeing on the file system so it has the advantage of being very simple but at the same time if you're going to run this for a long period you've got lots of data you now have to worry about data management of that data on a local system so you have to make it durable you got to back it up and you got to be able to restore it and in the case that you lose it and and that's what we sought to solve with cortex how do we make something that would be a horizontally scalable version of Prometheus so that's what cortex is so you can add instances of cortex and the data and it will spread out the load it will spread out the queries the data collection and it basically turns it into a horizontally scalable solution horizontally scalable and multi-tenant and multi tenant yes yeah very good yeah well as I understand some of the world so part of the way in which you guys are helping solve that long-term persistence of the samples that have young the data that's been pulled those time series metrics is in AWS on Andres s3 yes um but you know not that that's the only long-term storage target available and you know so I understand you maybe Cassandra might be a good fit for that as well maybe operationally a little more challenging to essentially there are there's an unstructured and structured part of the data set and we store those in different kinds of data stores so some of the data can just go straight into s3 as you say well any object store doesn't have to be s3 but are we built our implementation on AWS and so I degrees what we did first yeah right but hence and number of nines or less different but we also store some of some of the more structured information in dynamo so to be able to optimize queries you know I understand you know it may be speaking to dynamo a little bit i'm just maybe some of the challenges that you guys have faced as you've gone to bring forward cortex and begin to make it generally available has you has dynamo been one of those those challenges in terms of scaling it up no well dynamo makes it a lot easier i mean it's essentially it's a schema-less database and you can with tunable consistency and so it's a it's actually a really nice service to use on on the backend so we've been very happy with the dynamo okay okay very good yep um so how do you query you know it'd be this environment yeah so one of the other nice things about prometheus that you know Julius and Fabian we used to being able to essentially do sequel like queries in order to do troubleshooting so if you want to you're trying to track down a metric or find out what's happening troubleshoot a problem there's a whole query language Prometheus query language that comes with it comes part and parcel of it so you can interrogate that data cube on the back end in the storage and so what we did for cortex is essentially make that so you could paralyze and scale out those queries as well as those queries would still execute quickly even though the data is now spread out across multiple instances so that sharding out is that how does that work for you guys are within cortex I'm so in core tech essentially it's random so we we store the chunks we spread the chunks out randomly across the instances so they're routed to random and what that does is it and the randomness is important because that helps you paralyze queries we haven't done a lot of query optimization in the current version it's pretty pretty simple right now but that's certainly an area that we can take a look at or indeed anyone else can take a look at if they want to optimize right okay yeah Alex I'd had the pleasure of being able to spend some time with some of the other main tanners of Prometheus so Bjorn I think who's still at soundcloud and brian bazzill who's you know independent in cannabis doing robust perception at this point right but I mentioned those guys in part because part of my conversation there's come to understand that the genesis of Prometheus as you described kind of I'm part of that that prom ql that query language that alex is asking about being inspired from Borgman and as I understand it those that might be familiar with with or mon and the query language there would just feel right at home within prom ql that's right but interesting capability in that is you call it out before is the multi-dimensional data model this yeah these n number of tags that you can apply to have you guys seen you know customers or that really drawing them in that that particular capability or four maybe specific use cases that they have or the I depends on their level of sophistication if you've been doing this for a while then it clicks very quickly as to why this might would be useful right because you know what the limitations are of time series storage and time-series databases alright so having the multi-dimensional but it's if you're not familiar with it it'd be like multi-dimensional what you know what is that so depends are from the view with the problem set okay but in this but in this but for those who are accustomed to it what are they using it for well it's in a dynamic environment it's really useful to be able to correlate all those things together because you want to know you do want to know for example which host your container is running on and you want to know things about that host like you might want to know memory pressure or CPU and because that if it's if the content is not working properly it could be because the host is overloaded so being able to move up and down the levels of granularity is one of the advantages of that multi-dimensional query model right so you can you can go take a look at the host or you can look at the individual container and you can correlate between those two sets of statistics really being able to slice up your reviews in many different ways right well you know so it just strikes me that you know prometheus it wasn't that long ago that was adopted into the sea and CF you know Alexis Richardson is you know a union weave itself is just very much so helping within that environment and stewarding things and there was another announcement just yesterday here at cloud native con about fluency being adopted right to are we are we to be expecting sort of affluent d as a service some you know coming forth third we can we talk about that yeah are you would um yeah maybe maybe I'm gonna gonna reserve the right to talk about that more in the future I mean we where users affluent d ourselves that we've works so here's maybe that's more of an interesting questions yeah does that you know perspective from you on whether or not that that benefits your use of fluent des as it gets adopted that's right yeah I mean we want to be able to practice what we preach in the CNC F and so as part of the the TOC and as you said alexis is that coo we works as the chair of the TRC we want to build this in incubate in the CNC a4a you know a tool set and I trying to pick winners but we're trying to incubate a tool set of you know tools that you can use to build these new cloud native applications and so one of the beliefs of the CNC f is by incubating these projects you're making easier people to understand the patterns and find software that helps them do that the other thing about how we think about this and how the TRC thinks about this is we're not saying there is a single stack that is the answer and you should use Cuban essays and should use fluency and Prometheus and you know that's it so I expect that will have you know overlapping projects in some areas yeah it's more like a reference architecture but you know if you don't want to use Prometheus fine you know you can use something else we're not telling you to do that well there might be two things that do the same thing inside of it potentially inside of the CNC f and so tell us how we've works will offer cortex then so we're offering service called we've cloud is currently in beta and so essentially cortex is the technology that depends one of the technologies that underpins that service okay now you can use it like a host of Prometheus service if you want so if you're already familiar with Prometheus and you're using it and you don't want to manage it yourself you want want somebody else to run it you can absolutely use it that way and we've cloud but we want to do a lot more with that capability essentially it is giving us a really great way to capture all these metrics directly off the infrastructure directly had the applications do that a very automated fashion very scalable fashion and then we can you know integrate that with with other fun things in weave cloud how does that then change your overall focus that we've work we've works overall well yeah we started out with networking and what we've heard from customers around networking is like you know this is really great we have we often get happy customers we never knew we're using we've and they're already in production with their application and and they say it's working great but you know we might need support at some point so can we talk to you about giving you some money to you know to help us support our production application it's a so it's really great to hear those stories because they've been able to get to production without having to ask for help right yeah so the pennekamp are getting in production ask for help but then you know so the what kind of so what can I help do they want well they want to be able to troubleshoot problems should they occur right they want to be able to understand the health of their weave network they want to be able to understand the health and network overall they need to be asked answer the question is it the network right you are yeah something's not working is it the network and so I must be the network sorry that's right I talking to some customs in New York last week and they laughed when I said that to them because they're like yeah that's that happens all the time that's happens every day right just yeah if you're a network engineer you're just used to being the scapegoat that's right Network engine is like it's never the network and they and they at the software guys ago yes it is so we plowed a something until proven innocent act ly so we plan a really great way of first of all visualizing seeing what's happening because you see the live view of your application or this communications and being able to manage that but then when you start to do that and you realize that this monitoring and these capabilities some of which are powered by cortex these capabilities you know can help you understand your application more and you know go beyond just the networking use case into understanding the behavior of my application and making it easier for me to understand what's going on and easier for me to find problems when they occur and so that's the direction we're heading in makes sense yeah the application just continues to be take be the king kennedy to take yes see the most important here so so is this the den that is this now that the direction that you're gonna take with we have works as a company then that's right yes right okay yeah great well good well Matt Matthew thank you very much for taking some time to talk with us and learning a little bit more about about cortex and you know in the direction that you guys are taking with weave works and we're always interested in following you guys what you're doing so thanks for talking about right well thank you for the time today really appreciate the opportunity thank you thank you thanks [Music] thanks to Cisco for sponsoring our day of podcasting it Kubek on we had some great conversations thanks again to Cisco you can learn more about cisco and their micro services platform at mantle dot IO that's ma n TL dot IO [Music]
Original Description
As monitoring one’s stack makes the transition from a traditional infrastructure setup to monitoring cloud native containerized stacks, tools such as Prometheus has continued to grow. Initially developed by a team of SoundCloud engineers including Julius Volz and Brian Brazil, Prometheus became one of the de-facto solutions to turn to when looking for a monitoring platform able to scale to the needs of a containerized infrastructure.
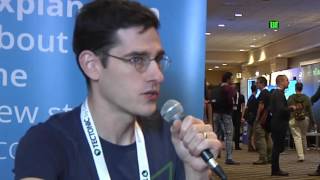
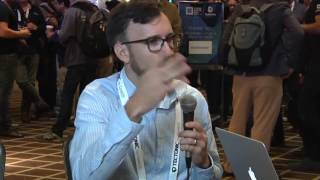
On today’s episode of The New Stack Makers, Weaveworks COO Mathew Lodge spoke with TNS Founder Alex Williams alongside co-host SolarWinds Cloud Technology Lead Lee Calcote at CloudNativeCon 2016 to discuss how Weaveworks new multi-tenant, horizontally scalable Prometheus-as-a-Service project, Weavecortex, aims to change how developers work with their data.
Listen on SoundCloud: https://soundcloud.com/thenewstackmakers/weaveworks-horizontal-scaling-prometheus
Watch on YouTube ↗
(saves to browser)
Sign in to unlock AI tutor explanation · ⚡30
Playlist
Uploads from The New Stack · The New Stack · 3 of 60
1
 2
2
 ▶
▶
 4
4
 5
5
 6
6
 7
7
 8
8
 9
9
 10
10
 11
11
 12
12
 13
13
 14
14
 15
15
 16
16
 17
17
 18
18
 19
19
 20
20
 21
21
 22
22
 23
23
 24
24
 25
25
 26
26
 27
27
 28
28
 29
29
 30
30
 31
31
 32
32
 33
33
 34
34
 35
35
 36
36
 37
37
 38
38
 39
39
 40
40
 41
41
 42
42
 43
43
 44
44
 45
45
 46
46
 47
47
 48
48
 49
49
 50
50
 51
51
 52
52
 53
53
 54
54
 55
55
 56
56
 57
57
 58
58
 59
59
 60
60

What's Next for the Cloud Foundry Foundation in 2017 with Executive Director Abby Kearns
The New Stack
How Unikernels Can Better Defend against DDoS Attacks
The New Stack
Weaveworks is Bringing Horizontal Scaling to Prometheus
The New Stack
TNS Analysts Thanksgiving Special: The Evolution of Kubernetes and the Container Ecosystem
The New Stack
How Rancher Labs is Seeing Kubernetes Put to Work in Production
The New Stack
SAP Tests Kubernetes for Cloud-Native Enterprise Software Deployments
The New Stack
Event Marketing for Today's Developer Evangelists and Community Managers
The New Stack
NodeSource Introduces Certified Modules to Improve Node.js Security
The New Stack
How Lightstep is Illuminating the Case for Distributed Tracing
The New Stack
How OpenStack Aims to be More Inclusive without being Exclusive
The New Stack
How Shuttlecloud Saves Time and Money by Monitoring with Prometheus
The New Stack
Creating Analytics-Driven Solutions for Operational Visibility
The New Stack
Understanding the Application Pattern for Effective Monitoring
The New Stack
Building On Docker's Native Monitoring Functionality
The New Stack
The Importance of Having Visibility Into Containers
The New Stack
How Getting Your Project in the CNCF Just Got Easier
The New Stack
Tectonic Summit Pancake Breakfast: How to Sell Kubernetes to the Hypervisor-Minded
The New Stack
The Buzz at Tectonic Summit 2016 in New York City
The New Stack
Bringing Clarity to the Future of Node.js Modules
The New Stack
How FluentD Can Help Monitor Microservice Architectures Through Unified Logging
The New Stack
Reshaping Front End Development with Warehouse.ai
The New Stack
2016 Year End Wrap-Up: Discussing Docker, OpenStack, and Open Source
The New Stack
Here's Why You Should Build a Robot Using Node.JS: Because You Can
The New Stack
How the Node.js Foundation is Utilizing Participatory Governance Models
The New Stack
Set Up an MongoDB Replica Set in Less Than an Hour Using Bitnami Packages
The New Stack
Determining Who Bears the Burden of Ensuring NPM Module Security
The New Stack
How Intel Snap uses Telemetry and Kubernetes to Drive Enterprise Efficiency
The New Stack
How the NFL Scored a Touchdown with its Open Source React Framework Wildcat
The New Stack
Aporeto CEO Dimitri Stiliadis: When it Comes to Security, Context is King
The New Stack
The Buzz at Node.JS Interactive
The New Stack
Why Going Serverless Doesn't Mean 'No Ops'
The New Stack
How Node.js is Transforming Today's Enterprises
The New Stack
JJ Asghar Interview
The New Stack
How Capital One is Using APIs to Streamline Auto Financing
The New Stack
SXSW 2017: How Machine Learning Differs From Regular Programming
The New Stack
SXSW 2017: Data-Driven Applications with Capital One DevExchange's Hydrograph
The New Stack
SXSW 2017: How Good Engineers Make Bad Business Decisions
The New Stack
CloudNativeCon & KubeCon EU Pancake Breakfast 2017: Kubernetes and the Multi-Cloud
The New Stack
CNCF Executive Director Dan Kohn: What's Next for CNCF in 2017
The New Stack
Exploring the Latest Container Runtime Projects in the CNCF
The New Stack
Exploring the Future of the Kubernetes Ecosystem
The New Stack
Kubernetes and Continuous Deployment
The New Stack
Kris Nova of Deis at CouldNativecon/Kubecon in Berlin
The New Stack
Docker's Quest for Simplicity with the Evolution of Containerd
The New Stack
Developers First: The Cloud Foundry Service Broker API and Kubernetes
The New Stack
Mapping the Future of CoreOS's rkt in the CNCF
The New Stack
Red Hat and Dell EMC: Two Perspectives from DockerCon
The New Stack
Capital One Opened its APIs to Third-Party Developers — Here’s What They Learned
The New Stack
SUSE Joins the CNCF, Brings Kubernetes to OpenStack Cloud 7
The New Stack
How Capital One Brings Open Source To The Banking Industry
The New Stack
OSCON Is Coming Back To Portland, A Show Wrapup With Co-Chair Kelsey Hightower
The New Stack
Dev Or Ops Doesn’t Matter, You Need Observability
The New Stack
Taking The Next Steps In Developing An Open Source Culture
The New Stack
SXSW 2017: How Capital One Became Technology-First With Open Source
The New Stack
Apcera Old Apps Spanning New Clouds
The New Stack
Provenance: The Peace of Mind Chef Habitat Seeks to Deliver
The New Stack
InSpec: Human Readable, Automated Compliance
The New Stack
The Evolution of SAP HANA Express
The New Stack
Women Engineers Who Inspire And Never Give Up
The New Stack
Three Perspectives on the Evolution of Container Security
The New Stack
More on: Systems Design Basics
View skill →


Related Reads
📰
📰
📰
📰
What Is an MCP Registry? (And the NxM Problem It Solves)
Dev.to · Sahajmeet Kaur
Built a suite of client-side dev tools to fix the "production data" privacy gap
Dev.to · Rayan Ahmad
5 Best BrowserStack Alternatives to Optimize Your Testing Infrastructure
Medium · DevOps
️ The Lifecycle Symphony: A Senior SRE’s Deep Dive into Init and Sidecar Containers
Medium · DevOps
🎓
Tutor Explanation