Data Transformation in the Cloud | Google Cloud Data Analytics Certificate
Key Takeaways
Data Transformation in the Cloud using Google Cloud Data Analytics Certificate
Full Transcript
[Music] hello there you're making great progress on your path to becoming a data professional congratulations throughout your learning Expedition so far you've explored the basics of cloud data analytics and how to store and manage data in the cloud next you'll learn how to work with the data to prepare it for analysis in this course you learn to identify the quality of the data you're working with and explore methods for transforming and processing that data it's important to keep in mind that the cloud data professional will transform and process Data before analyzing which makes the steps you're about to get familiar with essential hi there I'm Alex I'm a Deen analytics customer engineer this means that I lead a customer or prospective customers dat in analytics technical projects which can be anything from technology advocacy to architecting Solutions I first learned about data transformation and my first job out of college in my role I was tasked with identifying fraudulent transactions on the company website since the website had millions of visitors a day it was important to cut through the noise and transform the data in a way that was useful and applicable for our analysis ultimately keeping Bad actors off the website and creating a positive environment for our users in the process learning about data transformation in my first role laid down the foundation for the rest of my career now let's get back to what you'll learn we'll start with an overview of the data journey and its importance including collection processing storage and transformation of data next we'll explore the data Pipeline and various methods for extraction transformation and and loading then you'll discover how to use data transformation plan to meet the business needs of your organization you'll also learn transformation strategies learning data transformation is key to Preparing quality data that will lead to actionable insights don't forget I'm here to help you every step of the way you can work at your own pace so review videos and resources anytime you need you've got this by the end of this course you'll know how to process and transform data into a consistent workable data set let's get started hi there I'm Alex I'm a Deen analytics customer engineer a typical day for me may include demoing Solutions working with customers to develop their analytical strategies and helping solve data problems I've been interested in stem for as long as I can remember I studied science and engineering throughout school I especially loved being able to stay up late and use the campus telescope for my research on planets and stars I started my career as an academic researcher working with astronomy and physics I love the analy iCal aspects of that work my Pivot to the tech industry was a huge period of growth for me as I was moved into a field I didn't have much experience in but was able to learn grow and Thrive one of the biggest challenges I faced early on was learning how to write SQL to query data while the language was new to me I was familiar with problem solving and was able to pick it up with enough practice and studying writing SQL to answer analytical questions has been the foundation for my career in Tech now I love serving as a data practitioner helping companies and Learners like you to apply strategies to learn the most insights from their data All Aboard let's steam ahead with the data Journey coming up we'll introduce the data journey and how it relates to your role as a cloud data analyst first we'll review the data Journey process and its role in improving data driven decision-making next we'll review data collection techniques then we'll explore data transformation and the different methods used for transforming data finally we'll introduce you to a variety of methods and tools for data processing and storage when you're ready to get started get your passenger ticket and meet me in the next video in this video we'll explore how data moves through the cloud using a process called the data Journey the data Journey Begins when you as a cloud data professional locate data and the journey ends when you present the data analysis to stakeholders the data Journey has five stages collect process store analyze and activate in this course we'll cover the first three stages collect process and store the last two stages analyze and activate will be covered in a separate course understanding the data journey is important because organizations need a structured way to collect data to prepare for analysis and inform data driven decision-making it is equally important to understand the unique role of each stage of the data Journey the first stage is to collect data during this stage you'll find and gather the data you need the second stage is to process data this stage can also be called transformation because it is the process of transforming data into a usable format during this stage you'll review and explore the data to identify issues you'll also clean organize and standardize the data the third stage is to store data once you've located and processed the data you'll need a place to keep it you'll have several options to choose from depending on your business needs including storing data locally or in the cloud the fourth stage is to analyze data during this stage you'll identify Trends and patterns to uncover insights your users need the fifth and final stage is to activate data this is the final result where you'll present your visualizations to your stakeholders and use the insights from the data to make decisions and take action As you move through the stages of the data Journey it's important to know that the process isn't linear the data journey is an iterative process meaning you may move back and forth between the stages for example after you collect the data and move forward into the processing stage you may realize you need to go back and find more data to answer the stakeholders business question also the data Journey isn't a one-time process and is instead repeated you'll need to go through this process multiple times and the data journey is tailored to each project you'll likely find differences between projects that change the process for example if the data requires extensive cleaning you may need to spend more time in the processing stage it's important to call out that the tools you use can also affect the process for example with some tools storing data happens before processing or it can be the other way around together the stages of the data Journey represent a foundation you can build on to analyze your data and provide insights for your users so imagine as a cloud data professional your current project is to create a dashboard for a sales team where do you start well you start a data Journey the first step of the data journey is collect you might also refer to this as the Gathering stage data collection is the process of identifying and finding the data that can be used to meet a specific business need and bring it all together because it's the first stage of the data Journey data collection is essential for creating a solid foundation for your data analysis and visualizations there are four steps within the collection stage before you can find the right data you need to know what you're looking for so the first step is to identify specific questions you want to answer with your data to do this you'll work with your stakeholders to determine their needs once you figured out the questions you're trying to answer you can move into the Second Step data Discovery during this step you'll find the data you need data is usually stored in various formats and in different sources you'll also need to explore how the data sources you select relate to the things you trying to measure and understand to identify the data you need to gather the third step is data Gathering keep in mind you'll likely be looking for data in m multiple locations also the data will be in different formats so you will have to find how to work with each data source and evaluate how often you will need to update the data this can be a time-consuming process when you identify the data's location you can collect it into a single usable staging area the final step is data staging once the data has been gathered you will need to find a way to bring together the data into a single usable staging area once the data has been brought together it is ready for the next stage in the data Journey process as the first stage of the data Journey good data collection is essential become comfortable with this process so that you can begin to create good foundation for your data analysis and visualizations at this point in your journey as a cloud data professional to create a dashboard for a sales team you've identified what data you need you've collected the data and you think you're ready to move forward to the second stage process but not so fast you're going to need to work with the data before you use it for analysis raw data can be in different formats and have a lot of problems that need to be fixed for example during the collect stage you might find data that's incomplete or missing you might also find duplicated or incorrect data these issues will cause errors in your analysis so it's important to identify them now in this process stage and correct any errors and make sure the data is in a format you can use before moving forward to the third stage store data transformation is the process of taking raw data and converting it into into a usable format basically it's changing inconsistent data formats into a consistent format that you can use for analysis and visualization development to ensure that the data is error free and in a format that you can use sometimes the term data processing is also used to refer to data transformation but they are not the same data processing is a big term that covers a lot of different things it can include collecting data cleaning it up transforming it analyzing it and visualizing it data transformation is a more spe specific type of data processing it's the process of converting data from one format to another or from one structure to another the goal of data transformation is to provide your data team with data that you can all access and use this includes addressing issues like correcting errors adding new information to the data and reducing unnecessary data detail while there are many different ways to transform data there are six basic types of data transformation including data smoothing attribution construction data generalization data aggregation data discretization and data normalization the exact method you use will depend on the type of data you're transforming and how it will be used there are two basic methods to approach data transformation you will either perform data transformation manually with SQL or another common language or you'll use an automated pipeline the method you choose will vary by project and the type of data you're using now you're set to move on and decide whether to perform data transformation manually or a automatically so that you can create a solid foundation for your data analysis taking time here to make sure your foundation is solid will help ensure the success of your future data visualizations okay so as a cloud data professional you're well on your way to completing a project to create a dashboard for a sales team it's time to transform your data and you'll have to figure out the best method to use you can select either manual or automated data transformation both data transformation types have the same goal to prepare data for your an analysis let's explore both methods manual transformation is the use of coding languages to affect data transformation without the aid of software programs this includes languages like SQL Python and R SQL or structured query language is what you'll be working with for the remainder of this course SQL is used to get data out of relational databases python is a highlevel general purpose programming language that works with libraries like pandas to analyze and visualize data pandas is an open source data analysis and manipulation library that can be used with python an R is a programming language used for statistical Computing the packages in R provide a variety of methods for implementing data simulations to transform data like arrange filter and select while you can use manual transformation on data sets of any size it's best for smaller data sets because of the time effort and accuracy involved to code not only does the code have to be created but you'll spend additional time testing troubleshooting and maintaining at automated transformation is the use of processing and scripting tools with less or no programming compared to manual transformation these processes are usually combined to create an automated workflow these tools make working with your data so much easier than manually transforming data alone although you don't have to use much code with these tools you might still end up using coding languages like SQL and python to make modifications within the tool automated transformation tools are best for large or High Velocity data sets and can be local or in the cloud the tools you use will be based largely on the needs of your organization and the goals you're trying to reach with your data so which transformation method should you use there are several factors that will influence your decision the size of the data sets is probably the most important the larger the data set the harder and more timec consuming it will be to transform manually manually transforming a larger data set also increases the chances for errors it's also important to consider how long it will take to process the data if speed is important you might choose to use automated transformation so that you can more quickly and accurately transform the data the use of automated transformation tools is also dependent on tool availability since these tools cost money they might not always be available so the manual process could be your only option you might also want to use a combination of transformation methods even with access to automated transformation tools you may have to manually use programming languages to make some changes to your data each method of data transfer information has its advantages and you'll likely use both over your cloud data professional career you've made it through another topic during this course you learned about the steps in the data journey and its importance in your role as a cloud data analyst first you reviewed the concept of the data journey and its role in improving data driven decision-making next you learned about data collection techniques and explored additional details for data collection then you'll explore the critical importance of data transformation and the different methods for transforming data finally you learned about the various methods and tools used for processing and storing data good job on your progress so far we've come to our last stop of this section in the data journey and the train is ready to move to the next station hi and welcome back congratulations on your progress so far recall the five stages of the data Journey collect process store analyze and activate once you've started a data analysis project when you're in the midst of the process stage it's time to explore how data pipelines can help you address business needs let's cover the three main stages of a data pipeline extract transform and load we'll start by discussing how data pipelines convert raw data into a format that's ready for storage and Analysis then we'll dive into the stages of a data pipeline in more detail we'll begin with the extract stage and discover how data is collected from various sources and ingested next we'll discuss the role of the the transform stage and the pipeline process and how data is cleaned and manipulated finally we'll review the load stage the stage where data is loaded into destination storage and made available for storage and Analysis let's get started in cloud data analysis you can think of data like a set of raw materials that determines how our project moves forward the data needs to be produced efficiently and in a consistent way as you may already know a data pipeline is a series of processes that transports data from different sources to their final destination for storage and Analysis there are three main stages in a data pipeline extract transform and load let's consider an example a toy factory uses an assembly line to make toy cars in the first stage one worker gathers all the parts they need to make a toy car and puts them on a tray then they pass the tray down the conveyor belt to another worker who assembles the car after the car is assembled the third worker packages it as a cloud data analyst instead of toy cars you'll be working with data let's explore each step in a data pipeline extract is the stage of retrieving data from one or more sources in a data pipeline in this first stage the team gathers raw data from various sources and moves the data to a temporary staging area here's an example an animal rescue organization has a mission to locate and protect missing and lost pets the data team for this organization wants to create a data pipeline they have two sources of data one is a CSV file that includes the registration number of each animal's microchip the second is a database that includes information about pet owners including contact information and the registration number for each pet during the extract stage the raw data from both of these sources is copied and moved into a staging area using techniques that are specific to each Source once the data team collects all the data they need into the staging area the extract stage is complete and the data is ready to be moved to the next stage transform transform is the stage of taking data cleaning it and putting it into a standard format in a data pipeline before the data team can convert store and use the data for analysis they check the data for duplicate entries or obvious errors once the data has been transformed it's ready for the final stage the load stage load is the stage of inserting data into the target database data store data warehouse or data Lake in a data pipeline in the case of the animal rescue organization the transformed data will be loaded into a data warehouse this will name able the data team to store the data for future analysis and visualization Pro tip data pipelines can be complex and not all data pipelines work exactly the same just like a factory assembly line a data pipeline is tailored to the specific task needed to get a specific data job done in an efficient and consistent way for this reason the stages in a data pipeline may not always happen in the same order and the processes within each step may change depending on the data but one thing that all data Pipelines have in common is that they're like data assembly lines they're a valuable tool for automating the process of extracting transforming and loading data data pipelines can also help organizations save time and resources improve data accuracy and get more value from their data what I love about this career path is that every single day is different hi my name is Alyssa and I am an account executive here at Google with a background in data and Analytics I get to work with all different types of organizations to help them figure out how do they solve their challenges with data so basically taking any sort of complex data problem and helping make those connections I've always been a very curious person you can ask my parents I was constantly asking them questions and so being able to lean into that in this role has been awesome but I also had to develop my skills over time so when it came to any of those more technical skills I had to lean into being more formalized with my learning and being more systematic about my Approach but having that underlying curiosity and hunger for learning has really served me well one of my very first jobs was working as an attendant at tennis courts I was in charge of cleaning up the courts I was in charge of making sure that everyone was sharing very effectively and I was also in charge of managing all of the lessons and activities that would happen on that Court when you look at that now you might say how does that relate to data and analytics um and what I found was that I was constantly collecting information about all of the people who are participating in the courses all of the people who were trying to get time on the courts and then I was trying to figure out how do we make this more efficient when you look at any type of problem it all comes down to what is the information we're trying together and what is the goal outcome that we're trying to achieve when I first was graduating I didn't know what I wanted to do and the first role I went into I was very fortunate where I got to spend a little bit of time working with all different Cloud Technologies but I definitely gravitated towards the data and analytics Solutions because I could see so tangibly how we were solving problems with them when I was starting out I would have loved to have known that nobody has all the answers and so that ties into my whole ethos around asking questions and being curious you might feel sometimes like you should know the solution right off the bat but nobody does and if they are they're probably pretending so I found that if I had been more comfortable earlier on with just going in as a learner that you'll get the better outcome the best advice that I can give you is to stay persistent there are going to be times when the problems are really hard to solve or you'll have no idea where to start but if you stay persistent you will figure it out and you will continue to progress as a data analyst how you organize your data pipeline can have a huge impact on the efficiency and effectiveness of your data storage and Analysis to start choose an integration technique that works best for the business and its data needs the data pipeline integration techniques will'll discuss here include extract transform load stages or ETL and an alternative order of those stages elt let's dive in and briefly review what each of the stages entails e stands for extract extract is the stage of collecting data from one or more sources T stands for transform transform is the stage of taking data cleaning it and putting it into a common format L stands for load load is the stage of inserting that formatted data into the target database data store data warehouse or data Lake extract transform and load are all stages in a pipeline process that data analyst use to move data from the source and get it ready for storage and Analysis now that you know what e t and L stand for it's time to dive into how ETL and elt pipelines work ETL or extract transform and look Lo is a type of data pipeline that enables data to be gathered from Source systems converted into a useful format and brought into a data warehouse or other unified destination system ETL has been around for decades as a way to integrate and manage large amounts of data but recently data teams have adapted their process moving their data sources and storage solutions to the cloud ETL brings data from various sources together in one place this makes it possible for data teams to analyze the data and identify Trends and insight that can help Drive datadriven decision making for example a university might use ETL to integrate data from its student information system Financial records and course catalog this allows the university to track student enrollment Financial Trends and course performance so the university can make informed decisions about which courses to continue which courses to expand and how many faculty to employ each semester an alternative to ETL is the elt pipeline where the loading and trans stages are swapped elt or extract load and transform is a type of data pipeline that enables data to be gathered from data Lakes loaded into a unified destination system and transformed into a useful format the elt pipeline is a popular option for organizations that need to process large data sets in the cloud but why load data before transforming it there are three reasons save time enable scalability and increase flexibility transformation can be timec consuming especially if you have a lot of data to process when speed matters like with streaming data and near realtime analytics elt may be a better choice loading your data first is also a great way to take advantage of the scalability in the cloud and in some cases you may not know exactly how you will need to transform your data in this case elt gives you the flexibility to load your data first and then transform it later for example a manufacturing company wants to track their production data as soon as it's available or near real time so that they can make data decisions quickly a manufacturing company's data comes from a variety of sources including a production control system machine sensors located around the manufacturing floor and a quality control system the company's data team could use the traditional ETL pipeline to extract the data from each Source transform it into a common format and load it into a data warehouse but that would be slower and could impact performance if the company uses the elt pipeline instead they can the data before transforming it then they can make the data available in near real time this gives the data team more flexibility since they can change the way transformation is done as needed to wrap ETL and elt are both data pipelines that move data from one location to another as a cloud data analyst you'll decide whether to use either the ETL or elt pipeline depending on when you need to transform data when organizations need to make decisions they rely on a variety of sources to get the data they need the range of possible data sources is tremendous just a fraction of potential data sources includes websites Point of Sales Systems social media and even Machinery sensor data it's important to call out that each individual Source only makes up part of an organization's data needs to have a more complete understanding organizations must have a way to bring their data sources together this is where data ingestion can help data ingestion is the process of collecting data from different sources and moving it to a staging area as a data analyst data ingestion is an important first step in a data pipeline to get your data ready for further processing and Analysis but not all ingestion techniques work the same so it's important to choose the technique that works best for your data and one important factor that you'll rely on when deciding which ingestion technique to use is whether the data is time sensitive time sensitive data is data that must be acted on within a specific time frame or it loses value when plan a time sensitive travel itinerary you might consider which mode of transportation you're going to use to get from one destination to the next and you will probably also consider how quickly you need to arrive at each location buses are a great and economical option if you don't mind waiting a bit you can show up at the bus stop at the scheduled time wait with other Riders and the bus will take you to your destination but if you need to get somewhere in a hurry a taxi is a faster option in a taxi you can go straight to your destination without waiting or sharing your ride as a data analyst the same is true for how you plan data ingestion like the best example if your data can wait a bit before you process it batch ingestion is usually the best option but if your data is time-sensitive like the taxi example you'll probably use streaming ingestion let's dive into how each technique Works in more detail batch ingestion is a method of collecting data over time and processing it in groups also called batches during batch ingestion when data becomes available it's not immediately processed instead the data Waits over a period of time before it's processed as a group this processing happens on a regular schedule which makes it a good choice when working with a high volume of data or when it's not critical for data to be ingested right away as an additional benefit this processing schedule also makes batch ingestion the more economical choice because it requires less computing power and storage space here's an example a large International nonprofit organization uses batch ingestion to collect data on donations made to its website and over the phone on average it receives over a th donations a day and these donations come in around the clock once a day at a scheduled time the nonprofit uses a batch ingestion tool to collect the donation data received in the past 24 hours from both sources sort and group the data into a single batch and load it into a staging area once in the staging area the data is ready to be processed stored and used for analysis the nonprofit can use this data to generate reports on ation trends like the number of daily donations the average donation amount and donor count by country the second main way to ingest data is streaming ingestion streaming ingestion is a method of collecting and processing data as soon as it becomes available streaming ingestion is best for data teams that need to process and act quickly here's an example a pharmaceutical manufacturing company uses sensors to monitor the temperature of their dryers the company's data team uses streaming ingestion of the sensors temperature data data as soon as it becomes available this allows the company to track temperature changes in near real time to prevent any issues in their pharmaceutical products if the dryer temperature starts to rise or fall below a safe threshold the company can respond quickly to return the dryer to a safe temperature by monitoring the temperature of the dryer in near real time the company can ensure the quality and safety of its products and keep their equipment in working order now you understand the data ingestion techniques and how to consider time sensitivity when you choose a technique choose batch ingestion or streaming ingestion to get the data you need when you need it data mapping is a key part of the data Pipeline and can be a complex process but you may have done something similar before for example let's say you're an avid bird watcher while at a park you spot a bird species that you've never seen before so how do you identify it well first you closely observe the bird and identify its size shape color markings behavior and call then you can compare these features that you observ to descriptions of known bird species using a field guide by matching the bird's features to the field guide you can try to identify the bird that's what data mapping is like data mapping is the process of matching fields from one data source to another and like identifying birds with a field guide data mapping Compares information to a known entity data mapping can use an entity like a schema to make an identification data mapping is also a critical part of the data pipeline as a data analyst once you ingest your data you can map the data so you can easily understand and analyze it this ensures the data is consistent and standardized here's how it works for example the data team from a large Public Library wants to combine data from two sources to track the 12 month history of their book circulation and number of new requests patrons make the first data source is a library catalog that includes the international standard book number or ISBN title author publisher and publication date for each book they own the second data source is a circulation database that includes the barcode title author and due date for each book in their collection to combine the data the data team will need to find a way to match the fields between data sources in a way that makes sense to do this they can use data mapping first the team identifies the fields that need to be mapped in this case the ISBN title author publisher and publication date fields next the data team standardizes the naming conventions for the fields for example the title field in the circulation database is named book title while the title field in the library catalog is just called title but both Fields mean the same thing so the data team decides on one name in this case title to use for both Fields next the data team creates their data mapping rules the data mapping rules are a set of instructions that Define how the fields will be matched for example the library team defines a process for converting the barcode code in the circulation database to an ISBN number this is because the two Fields need to match when the data team begins to test and analyze the data once the data team defines data mapping rules the data team will next test the rules on a small subset of data this will ensure the rules are working correctly before applying them to all of the data next the data team creates a map that defines how the data fields relate to one another finally they take all of the data from the two sources and combine it into a single data set now the data team can process and analyze the data set of course this is just a simple example data mapping is usually much more complex data mapping can also be challenging to do manually and may be timec consuming and error prone that's why many data teams rely on data mapping tools that can automatically match one field to another when a data team is deciding between manual or automated data mapping the choice will largely depend on the structure of the data the data team needs to map the size of the project and the tools they have available no matter how an organization Maps their data data mapping is a key part of the data pipeline it ensures that data is standardized and consistent making it easier to use and analyze this can lead to better data quality which can help organizations make better decisions with their data when you go to a store the shelves are full of items of all shapes and sizes but how does the stores management track all these items stores regularly conduct invent vories this is the process of counting items making sure everything is in order and ensuring the expected number of available products are either on the shelves or in the warehouse profiling and cleaning data is like taking inventory of a store's items data profiling is the process of exploring data to identify quality issues it gathers information about the data structure format values and relationships some quality issue examples might include missing values duplicate records inaccurate data and incon consistent data formats once data profiling has identified quality issues data cleaning can begin data cleaning is the process of fixing or removing data quality issues this ensures that the data is accurate consistent and complete to understand how data cleaning Works consider an on the drum example with a data analyst named arpa arpa is a data analyst for a retail chain every month each store in the chain sends arpa data about the items in stock arpa's job is to get this data ready for storage and Analysis the task to fulfill arpa's job include profile the data and clean the data which includes fixing any data quality issues first arpa profiles the data this is important because it helps ensure the data is accurate and complete before it's transformed stored and used for analysis data profiling can be done manually but it's usually more efficient and effective to use a data profiling tool a data profiling tool can gather information about the data structure format values and relationships for example arpa might use a data profiling tool to identify the different columns in the data set like item name description price and quantity and stock arpa might also determine the data type for each column like a string for the name and a number for stock level arpa might also consider missing or duplicate values now arpa has a profile of the data and can start to clean it this involves fixing or removing any data quality issues identified during the profiling process and to ensure the data is accurate for example arp find that there are a number of duplicate item names or that some prices are missing finally arpa needs to fix any data quality issues to make the data complete so to recap data profiling and cleaning are important ways to prepare data to help improve data quality by regularly profiling and cleaning data cloud data analysts can ensure a business has the best possible data to make informed decisions when you think of a data pipeline you might imagine a linear process where data is collected processed and analyzed in a specific order but this isn't always the case in reality data pipelines can be more complex and flexible and the Order of the processes and techniques a data analyst uses in a data pipeline varies depending on the specific needs of the project for example consider you're a data analyst for a large school district and you have a data set of student data with errors in different formats in general it's best to clean the data before manipulating it but if the data is full of Errors you might want to use data manipulation to remove the most obvious errors first this can help speed up the data cleaning process and improve the accuracy of the results the techniques that you use and the order depend on the specific data that is why as a cloud data analyst it's important to have an understanding of the techniques available to you and how you can use them in various ways to get the data results you need let's dive into an example using three common ways to manipulate data and make it usable for storage and Analysis data standardization enrichment and conversion data standardization is the process of ensuring that all the data in a data set is in a common format this makes the data consistent and reliable so it's easier to process and analyze here's an example Kyle is a data analyst who is responsible for managing the product catalog for a large online retailer when adding new product to the retailer database Kyle notices the product names are inconsistent some of the product names are in all uppercase letters While others are in lowercase letters to standardize the data Kyle decides to use a data standardization tool to check the format of the product names and make all names in lowercase letters this will make the data more consistent and easier to process and analyze Kyle also wants to add the stock keeping unit or SKU number to each product to help track product stock quantities to do this Kyle needs data enrichment data enrichment is the process of adding additional information to data this can be done by adding new fields to the data or joining the data with other data sources Kyle uses the data enrichment tool to join product names from the database to skus in a product catalog this will add an SKU for each matching product in the database Kyle then uses these skus to help the retailer better track inventory and manage sales once Kyle standardizes the data to make it consistent and enriches it with new information Kyle then needs to format the data in a way that works with the destination storage data conversion is the process of changing the format of data to improve compatibility readability or make data more secure this can be done for a variety of reasons like to make the data compatible with a different system or application saving storage space or to make it easier to understand and use because the data is large and complex Kyle needs to compress the data before moving it to the destination storage so Kyle uses a series of tools to read the CSV and convert it into par par is an open- source file format that Source data as columns and optimizes the data for efficiency and Analysis so to recap data standardization and enrichment and conversion are three techniques you can use to manipulate your data and make it more useful and as a cloud data analyst ultimately the techniques you use will depend on your data and your business needs understanding the different options and how you can apply them will help you choose the best way to prepare and manipulate your data this will ensure that your data is in the best shape possible for storage and Analysis when data moves through a data pipeline it typically goes through three stages extract transform and and load or ETL in the extract stage data is collected from various sources in the transform stage data is clean manipulated and enriched and in the load stage D is moved to a new place where it can be used for analysis to help you better understand what happens during the load stage let's start with an example let's say you want to donate some items to a local charity first you sort through your belongings and collect what you want to donate then you clean up everything to make sure all the items are in tiptop shape finally you load the items into a charity truck so they can be used by others collecting the items to donate is like the extract stage in a data pipeline cleaning up the data is like the transform stage and the loading of the items onto the charity truck is like the load stage the load stage of the data pipeline moves the data into the destination storage while the load stage is typically the last stage of a data pipeline this is not always the case in an ETL pipeline which stands for extract transform and load the load stage is the last stage of a data pipeline but sometimes as a data analyst you will load the data before you transform it when this happens it's called an elt pipeline meaning extract load transform but no matter when the load stage happens the load stage has the same goal taking data from a staging area and putting it in storage here's how it works before loading data can be put into storage you first need to prepare the destination storage this will ensure the destination is ready to receive the data depending on the data this might involve creating new tables or directories or configuring the destination so it can accept the data then once you prepare the destination you're ready to load the data common ways to load data include batch loading streaming loading and incremental loading batch loading is a method where data is moved to a destination storage in groups called batches at a predetermined schedule batch loading is the most common way to load data it's efficient for large data sets but it can overload the destination storage if the data volume is high streaming loading is a method where the data has moved to destination storage in a continuous stream as soon as it becomes available streaming loading can be a good choice for time sensitive data this is because streaming loading ensures that the data is available in near real time which can be critical for making timely decisions streaming loading can also help prevent the destination system from being overloaded unlike batch loading the data and streaming loading is processed as a continuous stream even one record at a time incremental loading is a method where only the data that has changed since the last load is moved to destination storage incremental loading is a great way to save time and resources when loading data especially for large data sets that change frequently how often data needs to be incrementally loaded will depend on a few factors like the size of the data set how frequently it changes and the performance requirements of the destination system after loading data it's important to verify its Integrity in accuracy with a final check this ensures the data is ready for analysis when you work with large data sets you may find data loading is a complex process that's why many data teams use automated tools to help load data efficiently and avoid data loss and errors even if your team uses automated tools it's still important to understand how the data loading process works the data loading process impacts the quality of the data that you'll analyze and helps Drive decision-making across your organization an important role on any assembly line is the quality control inspector the quality control inspector's job is to make sure that all the products meet the required standards and are ready to be sent to Consumers for example a quality control inspector on a toy car assembly line May inspect each car for mistakes like missing or damaged Parts they may also compare each car to pre-written specifications to ensure they meet the required standards all this is done to ensure that each product meets quality standards and is ready to be used by consumers an assembly line inspection is a lot like data validation and a data pipeline data validation is the process of checking and re-checking the quality of data so that it's complete accurate secure and consistent data validation is a part of the extract transform and load or ETL stages in the data pipeline the data analyst can do this at any of these stages but it's especially important in the load stage when the data analyst moves the data into the destination storage that's because it's the last chance to fix errors before the data is used for analysis and Reporting like other processes the exact technique a data analyst uses to validate data will depend on the data they process and the organization's business needs some common ways to validate data that a data analyst can use include checking for type format uniqueness correctness and null values let's explore each in more detail for example consider working as a data analyst for an international nonprofit organization that collects data on donations made to its website and over the phone the nonprofits data team stores this data in a donor database that includes information such as donor name donor zip code and donation amount for the donor zip code field you want to make sure that it's a number data type and not a string you can use type validation to make sure the data is the right type you can use format validation to make sure the data is in the correct format for example if the values in a field should be formatted as dates your validation process should check to make sure they're formatted in the same way you can use duplicate validation also called uniqueness validation to check that there are no extra copies of Records in the data set for example if you have a table of donor records you want to make sure that there aren't two donors with the same name or with the same email address you can use range validation to check that the data is with a valid range for example if you have a field for the donor's age you would want to make sure that the age is a number that is between 0 and 130 you can use null validation to check for null values in the data set null values are empty or missing values and they can cost problems with data analysis and Reporting so what happens when you can't validate data that depends on the validation rule validation rules are a set of instructions that specify the standards that must be met for data to be valid and how to handle data errors sometimes you may discard the data you can't validate you might do this if the errors are too complex to fix or if the data isn't critical for example if a donor's age is outside of the valid range you might remove this data you may also load the data into storage is flagged flagging data that you can't validate alerts users that need to fix the data before use for example if a donor's email address is mispelled you might flag the data and fix it manually finally your data may be corrected automatically for example if a donor zip code is invalid the address may be matched against the database to correct the mistake automatically to sum up data validation is like quality control for data as data moves through a data pipeline it's important to make sure the data you're analyzing is complete accurate and consistent this will help ensure that when you use the data for analysis the insights are reliable and you can get the most out of your data hi there congratulations on completing this section on data pipelines as a data analyst now you know how data pipelines can help you address business needs and can put them to work during your journey you learned the importance of data pipelines and how they can help you address your business needs let's review what we covered in more detail to get you started we reviewed data pipelines their place in the data journey and their role in transformation then we explor the three stages of a data pipeline extract transform and load or ETL first you learned about the extract stage including the differences between batch and streaming data ingestion then youve explor the transform stage and how data is cleaned and manipulated for storage and Analysis finally you reviewed the load stage of a data pipeline including data validation and monitoring data pipelines can be complex but learning about how data is collected transformed and made ready for storage and analysis is important for a cloud data analyst congratulations on continuing your journey through cloud data analytics hi there and welcome now it's time to make some room in your toolbox for some new data analytics skills in this section you'll explore the challenges of data transformation in the workplace and learn the strategies you can use to get the most out of your data you'll also be ready to apply these strategies to beat businesses needs on the job just like a fine crafts person first you'll take steps towards measuring the benefits and challenges of data transformation as a cloud data analyst you'll work with the volume velocity and variety of data that large organizations generate daily and you'll consider a blueprint on how you can help organizations make use of that data next you'll learn the importance of Designing a data transformation plan that uses effective strategies to find the value in these vast vol volumes of data being generated every day after that you'll dive into how data transformation is used in the workplace this includes how to extract meaningful insights using aggregations and D duplication strategies to handle duplicate data finally you learn strategies to join and derive data effectively data transformation is a key skill for cloud data analysts and organizations of all sizes are you up for the challenge hi in this video you will learn about the challenges that face data teams when transforming data in the workplace and why it's important to have a reliable and highquality data transformation plan data is an essential raw material that drives business decision making but in recent years the amount of data being managed and stored by organizations has grown tremendously as a cloud data analyst working with large data sets you'll uncover the value of the vast ever growing intake of data to help provide critical insights to you your data team and your stakeholders but implementing a data transformation plan can be challenging especially when it comes to resources and data Integrity let's break these two challenges down data transformation can be resource intensive first you'll need access to enough computational power to process large data sets in the past this meant investing in expensive computer hardware that could perform a very large amount of calculations also called computational loads with the Advent of cloud computing you can now access computational power virtually this is a GameChanger for data teams as they can now perform data trans Transformations without having to invest in expensive Hardware but even though Cloud resources are easy to use and costeffective you still have to include the cost of cloud services when planning your project data transformation can also require a lot of storage extract transform load or ETL and its counterpart extract load transform or elt are pipelines for data transformation as a cloud data analyst you use pipelines to take raw data from various data sources process the data and then store it in a warehouse or a lake house for use and Analysis and visualization but sometimes you don't use all of the data stored this can cause organizations unnecessary storage fees to prevent these fees you must effectively manage storage usage this means regularly reviewing the data that's stored in deleting any data that you no longer need finally it can take a lot of time and effort to transform data data transformation requires many people with the right skills to execute the data transformation plan for organizations smaller budgets this can be a challenge so it's important to utilize the resources of cost-effective cloud services not all the tools you use for data transformation are the same some tools are better for certain tasks than others as a cloud data analyst you'll need to learn about the different tools available when you work with data in the cloud and how to use the right tools for your specific needs while resources are usually the largest cost for any organization data Integrity may be the most significant ongoing challenge for a data team this is because even a small error data can have a big impact on the results of a data transformation project data Integrity is the accuracy completeness consistency and trustworthiness of data throughout its life cycle errors in the data can impact data Integrity before and during the transformation process errors can occur in three primary ways mistakes like typos and other data entry errors can introduce issues into data and machines can also insert bulk reading errors into the data these errors can cause data Integrity issues if the data is not cleaned before transformation errors can also be introduced during the data transformation process for example converting data from one format to another can introduce errors like incorrect data types missing values and incorrect formating likewise using the wrong aggregation method can cause misleading results if these errors aren't caught before the data is stored and assessed for analysis mistakes can end up in the data used for reports and dashboards and this can compromise the Integrity of the data used for decision- making while you can never eliminate errors completely it's important to have an effective plan to help manage data integrity and minimize mistakes this will help ensure that stakeholders have the best data they can to make the decisions they need to drive the business forward as a cloud data analy you'll be responsible for finding value and the increasingly complex and massive amount of data that flows into your organization this can be a daunting task so it's essential for making informed decisions and driving business growth to do this you'll need to have a data transformation plan this plan will help you manage your resources and ensure data Integrity so that you can provide critical insights to your data team and your stakeholders hi in this video you'll learn how to use data aggregation aggregation is one of the most common transformation techniques you can use to gain meaningful insights from your data data is coming from everywhere smart devices and machines websites social media and videos and more and more of its arriving in near real time all this data is an opportunity to foster a more data driven culture but it's also a challenge for data analysts because of the sheer volume variety and velocity of this data can be overwhelming one technique that can help you get control of that data is data aggregation data aggregation is the process of gathering data and expressing it in a summary form aggregation can help you extract meaningful insights from data in three ways by managing data by making data more accessible and by helping You observe data Trends let's break down each one due to an increase in the volume and velocity of data in recent years businesses around the world face a rising need to acquire more and more data storage in reality businesses don't actually need all the data they store and here's a protap not all data is relevant or should be stored forever irrelevant data takes up storage space and makes it more difficult and labor intensive to find the data and sites you need to reduce the data clutter and reduce irrelevant data you can use aggregations let's explore an example every time a person clicks a link on a company's website multiple data points are generated including the exact time the link is clicked the IP address and the browser type to name just a few on a busy site this can create a massive amount of data being generated but not all of the data generated is relevant and useful aggregation can help you clean the data so that only meaningful data is stored and irrelevant data is removed to return to our example two important metrics the business's data team wants to track include the number of times a specific link is clicked per hour and the date and time of each click this data will help the marketing team plan their ad buys and forecast future traffic the rest of the data generated each time the link is clicked is not relevant to the business question so by scheduling an aggregation to count the total clicks each hour the raw data is reduced to a single data point the average number of clicks this aggregated metric can then be stored instead of the raw data using this strategy allows you to better manage the amount of storage needed while providing a metric that's useful for analysis aggregation can also help make data more accessible to the data team by reducing the amount of data they need to work with for example since the single data point the average number of clicks per hour is stored the data team can simply query that metric without performing calculations this can save time and effort aggregations also make it easier to spot Trends in data knowing the data Trends helps data teams provide analysis and visualizations so the business can make informed decisions for example since the data team can easily query the average number of clicks per hour they can chart the data to better understand how the data changes over time the marketing team can then use this insight to determine when the website link receives the most clicks they can use this information to better plan their ad buys and forecast future traffic of course that's just one example of how data teams can use aggregation to manage storage make data more accessible and help users spot Trends aggregation is a versatile tool to use in an organization's overall data transformation plan the possible benefits to a business are endless hi in this video you will learn about one of the most common errors you'll deal with as a cloud data analyst duplicate data duplicate data is a record that repeats the information in whole or in part of another record there are two types of duplicate data partial duplicates and exact duplicates partial duplicate is a record where only part of the data repeats another record let's explore how this works with an example a science organization database holds information about members from around the world but they may have a duplicate two records have the first name Eli the last name arnes and the exact same Madrid address but one of Records says the phone number 12 23555 and the other one has no phone number listed at all exact duplicate is a record where all the data repeats another record for example let's say the organization's data analyst reviews the database and notices that one entry was entered with exactly the same information including name address and phone number twice no matter how the duplication happens partial and exact duplicates can damage data Integrity this can lead to inaccurate reporting wasted resources and increased storage costs let's consider another example in this case the organization's data analyst wants to know the average price of merchandise sold in the last month but when they aggregate the monthly sales the result is higher than expected what went wrong they take a closer look at the database and spot the error there were duplicates one shirt that sold for $20 had been entered three times times this over representation of that value skewed the data ultimately when the data was aggregated using average the results were skewed but once they remove the duplicate data the data set is no longer skewed and they can get the accurate metric duplicate data can also cause wasted resources for organizations next consider an example of wasted resources in the hopes of improving merchandise sales for the next quarter the head of the science organization's marketing team wants to send an advertisement with a list of all the merchandise available to each member they know that each time an address appears in the data set the member will receive an advertisement and if the member's address appears more than once in the data set the member may receive multiple ads so they ask the organization's data analyst for help good thing too the data analyst knows what to do they find and remove any duplicates in the data before the ads are sent out making sure that each member receives only one ad this action preserves the organization's marketing budget for avoiding extra costs of course in these examples the data sets are small making the errors easy to spot and the cost of wasted resources negligible but imagine scaling these errors to the size of Big Data where there may be millions of rows and many duplicates hidden in the data with data sets of that size finding duplicates can be tricky duplicates also take up storage space which can lead to redundant data that bloats your storage and increases storage costs duplication is the process of eliminating a data set's redundant data and duplication is an important part of of an organization's data transformation plan data analysts can perform D duplication manually but they usually use automated D duplication tools data analysts use manual duplication to compare rows of data to identify duplicate values this is a good option to fine-tune small data sets but it can be time-consuming and inefficient for large data sets D duplication tools use algorithms to compare chunks or blocks of data this is a more efficient way for data analyst to find duplicates and large data sets especially partial duplicates whether working with small data sets or Big Data duplicates negatively impact data quality and can cause inaccurate insights that's why it's so important for data teams to have a plan to deal with duplicate data hey there in this video we'll explain joints a powerful tool that data analysts use to combine data from different tables as a cloud data analyst joining tables efficiently can be tricky two common challenges you may find when joining tables are missing data and no n values missing data is when the rows you expect to be returned do not appear in the join table but not all missing data is a problem missing data is usually the result of the type of join that a data analyst selects this is why it's important to understand the inner and outer joins and their impact on the data returned an inner join is a join that Returns the rows that match in both tables let's consider an example to find how this works kji a data analyst wants to join an inventory and information table both tables related by a shoe ID column which contains the shoe inventory number to find the matching data kji chooses an inner join but when kji reviews the join table some rows are missing this is because an inner join only returns rows that match in both tables any rows that do not match or emitted from or dropped from the join results for example the row with shoe ID of three appears in both the inventory and information tables so it's included in the join table but the row with the shoe ID of nine only appears in the information table so it's dropped to drop fewer rows and return more data kji can use an outer join instead an outer join returns both matched and unmatched rows from one or both tables there's three types of outer joins left outer joins return all the rows from the left side of the joint clause and only match rows from the right right outer joins return all the rows from the right side of the joint clause and only match rows from the left full outer joints return all the rows from both sides of the join CLA Kenji decides to use the most common outer join a left outer join kji places the inventory table to the left of the join Clause to return both matched and unmatched rows from that table Kenji then adds the information table to the other side of the join Clause only the Matched rows return from this table the left outer join results in more rows being returned including both matched and unmatched rows but it also introduces A new challenge for Kenji some rows in the joint table will have null values the unmatched values in the inventory table are represented as null values in the join table let's explain what these null values are a null value means there's no available value for a field in the case of an outer join a null means that no match could be found so the value for that field is absent here's a pro tip null values are not zeros or blank data it's also important to remember that null values are also not the same as zeros this can actually be useful to you as a data analyst for example when you return all the data from one table even if there's no match in the other table you provide a placeholder for Value that you have yet to determine or collect and add to the table data while n values are the intended behavior of outer joins they can be confusing for example it can be hard to tell the difference between n values that are a result of no match with the join and N values that existed in the data before the join was done this can impact your results when using an outer join it's important to think about how your specific data set and how null values may impact your analysis before deciding on an outer join so there you have it while joins can be tricky understanding the why behind missing and null values will help you as a data analyst join data more efficiently and provide useful insights but like all data transformation strategies the best approach is the one that makes the most sense for your data needs to find the answers to tough data questions sometimes you need to combine data in a new way for example say you want to find the total points earned by the top three players in a chess tournament you have the points of each player but to find the answer you need to find the top three player scores and then combine these scores to create a new metric the total points scored by the top three players in data analysis to unlock insights like this you can use data derivation data derivation is the process of combining and processing existing data using an algorithm to create new data the data derivation process starts with raw data sometimes called base data that already exists in the data set this base data is then transformed using an algorithm which is a process or set of rules followed for a specific task the algorithm deres new data data analysts can use this new data to uncover insights that aren't available directly from the base data alone let's explore how this works Ana the manager of a large shoe company has a business request for the data team the accounting department has identified that shoes that stay on the warehouse shelf too long are usually only sold at a steep discount cutting into profits to help track how long shoes stay on the shelves Ana has asked Kenji the data analyst to create a daily report of the shoes that have been on the shelf for 30 days or more but that raw data does not currently exist in the data set to provide Ana with the data she needs Kenji will need to use data derivation to start Ki explores the existing data kenji's goal is to find and transform the base data to create the report on your needs keni learns that warehouse workers scan and de timestamp each pair of shoes when the shoes reach a warehouse Shelf warehouse workers record this information as the arrival date timestamp Ki realizes that it's possible to use this arrival date timestamp data to create the new derived data in this case the algorithm that kji needs is a simple calculation that uses the shoe inventory number in the arrival date timestamp to calculate how long each pair of shoes is on the warehouse shelf and then convert the calculation into a formatted report to help Anya make decisions using this algorithm the arrival timestamp value for each pair of shoes is processed resulting in direct data Ki can then query the derived data as if it were an actual table in the database to analyze and visualize the data as a daily report for Anya and her team this Daily Report gives Anya a simple way to interact with the most up-to-date information about the warehouse shoe stock so she can make timely data driven decisions Anya will know what shoes in the warehouse should move to the sales floor before they lose value while working with derived data is a great way to increase performance and provide more in-depth insights to stakeholders data derivation does post some challenges for you as a cloud data analyst one of the challenges of derived data is accuracy derived data is processed data and is not always as accurate as the original base data this is because when you create derived data you take raw data and apply an algorithm to it if the algorithm has an error it can insert errors into the data also the base data itself can have errors or may even change after the data is derived so while you can use derived data for analysis you need to be careful when using derived data to create new derived data you should also be aware of data ownership and privacy issues when working with derived data for example let's revisit the shoe company when Anya hires a new worker to staff the warehouse the worker provides personally identifiable information or pii as part of the hiring process at that time the new hire was aware that the data was being collected and consented to its use but this consent does not apply to Future uses of the data this makes essential that any derivations involving pii are handled with the utmost care and follow all existing policies and regulations so to recap transforming existing data into new data is a valuable tool for cloud data analyst it can help you as a data analyst unlock insights that aren't readily available in the existing data alone and when done with care it can be a powerful strategy for answering more complex questions with data congrats you've made it in this Learning Journey you've delved into the challenges of transforming data in the cloud and how to get more value from your data you learned about different strategies and practice using them first you focused on the benefits and challenges of data transformation for organizations that work to find Value and huge volumes velocity and variety of data then you applied what you learned to design a data transformation plan that helped a marketing team solve a job ready business problem next you dove into Data transformation strategies including ways to extract meaningful insights using aggregation and data D duplication strategies you also explored ways to create new insights with derived data work with nulls and effectively use joints to gain a more holistic view of your data congratulations on your progress so far confidence is very important and something that one of my first managers ever told me is it's not what you know it's how you say it and it's something that I continue to tell myself day after day my name is Lauren and I'm A Cloud sourcing lead what that means is my team is responsible for reaching out to candidates for our open roles within the cloud organization the three top things that a candidate should do when updating or creating their resume is first tailor your resume to the job description you want to make sure you're pulling out key words and key indicators that match your experience um to ensure that the recruiters um can see pretty quickly the experience that you have that's relevant to the job description secondly do not exaggerate or do not lie on your resume that probably goes without saying but anything on your resume is technically fair game it can be asked in an interview so you want to make sure that you're being as accurate as possible my third tip would be keep it concise keep it short we definitely want to make sure that we can get all of your experience but you can cut things out that's okay too if it's not relevant to the job what makes a resume stand out for a recruiter or a hiring manager is an organized resume you want to make sure you have clear headers it's in chronological order and you have short and concise bullet points some ways that candidates can demonstrate their technical skills in interviews is to talk out their thought process and the answer to the questions they are asked the process of how you get there is just as important as getting to the correct answer some common interview question types are problem solving based questions experience-based questions and also leadership based questions the best way to answer a hypothetical question is really just talking through your thought process proc you're going to get a scenario something that you may or may not have experienced before and your interviewer just wants to see your thought process how you're connecting the dots um as you're talking through your answer the best way to answer a behavioral based interview question is really leading on your own personal experience this could be a personal experience from a previous job from school from a class and talking through that experience and that thought process it's very important to ask followup questions throughout the interview first and foremost you want to make sure you're understanding the question that's being asked um you have a very limited amount of time with your interviewer and you want to make sure that you're spending it as productively as possible I think some candidates worry that it's bad to ask questions I love when candidates ask me questions I want to make sure that my candidate knows what I'm asking so we can get to the best solution workpl skills are absolutely important during the interview process these are skills that can't be taught are you kind are you empathetic how are you showing up do you have that eagerness to learn or to thrive in ambiguity we really want to see candidates that have that self-drive and that self-determination a candidate can best position those workpl skills just on how they're simply answering their questions um you know especially in those behavioral questions like lean on those examples that show your grit that show maybe a struggle that you had and how you overcame it I'm not looking specifically for something that happened perfectly the right way I'm looking for someone that maybe had to overcome some obstacles to get to the right solution candidates hold a lot of power in the interview process we want you to be successful we want reasons to say yes so please show up be your authentic self be confident and show us all the amazing skills that you could bring to the company hi I'm Lauren hi I'm Ella let's step into an interview room and watch an interview that's in progress in this interview the questions will focus on cloud data analytics topics related to the data Journey from collection to insights we hope this will give you some tips for your next interview what interests you in a job in cloud data analytics what are you looking for in a role I'm really fascinated by the way that cloud data analytics uh is going to transform businesses so the ability to access and analyze massive data sets and datas and gain a deeper understanding about C customers organizations and markets is going to revolutionize different Industries and one thing that I'm really passionate about cloud data analytics is how it plays a role with machine learning and artificial intelligence imagine having access to large amounts of data with very powerful algorithms you can develop sophisticated models that can help you predict outcomes automate some tasks and also create personalized recommendations for customers for my next role I'm looking to be in more challenging projects and use my cloud data analytics skills to solve real world's problems tell me about a cloud data analytics project that you worked on what did you like most about it and what were some challenges the most interesting cloud data analytics project that I worked on was a project with a large retail company uh the goal of the project was to gain a deeper understanding of the company's customer base and how we can create Target Ed marketing campaigns the project involved collecting and analyzing data from variety of sources this would be their demographics online Behavior their purchase history and we use a variety of data analytics tool sets to retrieve and clean and prepare this data and our results was understanding that there are distinct customer segmentations within this company and we provided them with a set of recommendations on how to Target these segmentations and how to create relevant U marketing messages and because of what we did in this project the company was able to increase their conversion rates and customer engagements because now they're able to relay a little bit more targeted messages to their customers the most enjoyable aspect of the project was the ability to have access and work with large amounts of data sets and learning along the way new cloud data analytics tools and techniques let's suppose you're working on a project to help a cloud data team combin data from different sources what considerations would you think about to make sure users got the most out of their data there are a couple things that comes to mind one is data consistency and data quality the second one would be data schema and relationships third would be data security and governance and lastly it would be data accessibility and usability tell me about a time when you had to derive data from a raw data set that you received describe your process and any challenges that you experienced I worked with a large e-commerce company the raw data included product clicks page views and their online Behavior the process included me using machine learning techniques like natural language uh processing to understand the customer behaviors in different segmentations and based on the product reviews and then later I used clustering out algorithms to put customers based on their behaviors into different segmentations and because of the machine learning techniques that I use I was able to automate some tasks this really accelerated the process and increased the accuracy of our results we wouldn't able to get to the results that we did without these techniques great do you have any questions for me what are some key attributes that would make me successful in this role great question some key attributes to being successful in this role is really just bringing that Natural Curiosity problem solving and determination into your day-to-day this is a very collaborative role so you'll be working closely with your teammates to get to the right solution in this scenario Ella demonstrated how to explain impact when answering questions when interviewing make sure to explain the beneficial effects of any process concept or tool discussed congratulations on finishing this course I hope you're ready to use the new data analytics Tools in your toolbox and put your new skills to work my favorite part about working in cloud data analytics at Google is helping customers get to that aha moment while analyzing their data this moment usually comes from finding a key Insight they previously didn't know about before which can drive really impactful decision-making and have a positive impact on their business while it might seem daunting at first to find the key Insight in the massive amount of data businesses produce every day the techniques for learning can help accelerate your Insight investigation and lead to truly transformative work now let's go through all the things you learned in this course you started by learning about the data Journey including data collection processing storage and transformation next you explore the data Pipeline and the various methods for extraction transformation and loading then you discovered how to meet business needs with a data transformation plan and transformation strategies you now know all about data transformation the the key to Preparing quality data that leads to actionable insights great work throughout this course congratulations on this [Music] milestone
Original Description
Enhance your skills with hands-on labs on Google Cloud Skills Boost! Get started with the Beginner: Google Cloud Data Analytics Certificate: https://goo.gle/3xL0mUJ
[Course 3 of 5, Google Cloud Data Analytics Certificate] Hi learner! Tap into your creativity as we dive into the world of advanced principles of data visualization. You'll explore the benefits and challenges of transforming data in the cloud and the common tools and methods used to collect, process, and store data.
To earn this Google Cloud Certificate with a digital credential you can share, hop on over Google Cloud Skills Boost to complete the hands-on labs (available on desktop/laptop only) and graded assessments. There is a monthly subscription cost of $29 USD/month to earn the certificate on Google Cloud Skills Boost. https://goo.gle/4c7T3GB
Jump directly to the topics you want to learn:
00:00 Introduction to course 3
02:00 Alyx: Data analysts help others learn from data
02:33 Welcome to module 1
03:39 Stages of the data journey
06:17 Steps for effective data collection
08:13 The process stage ensures clean and consistent data
10:39 Manual and automated transformation
13:36 Module 1 Wrap-up
14:15 Welcome to module 2
15:13 Data pipelines in the cloud
18:14 Alyssa: Improve systems by collecting data and asking questions
20:49 The difference between ELT and ETL
24:53 Data ingestion methods that suit your needs
29:03 Data mapping helps ensure consistent data
32:47 Introduction to profiling and cleaning data
35:21 Common ways to manipulate data
38:50 Different approaches to loading data
42:19 Overview of data validation strategies and rules
46:04 Module 2 Wrap-up
47:11 Welcome to module 3
48:23 Challenges of data transformation
52:37 Data aggregation can make it easier to extract meaningful insights
55:56 Consequences of duplicate data and how to eliminate it
59:39 Overview of how joins combine data from different tables
1:03:15 Data derivation to combine data and obtain new insights
1:07:21 Mod
Watch on YouTube ↗
(saves to browser)
Sign in to unlock AI tutor explanation · ⚡30
Playlist
Uploads from Google Cloud · Google Cloud · 0 of 60
← Previous
Next →
1
 2
2
 3
3
 4
4
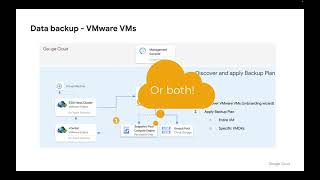 5
5
 6
6
 7
7
 8
8
 9
9
 10
10
 11
11
 12
12
 13
13
 14
14
 15
15
 16
16
 17
17
 18
18
 19
19
 20
20
 21
21
 22
22
 23
23
 24
24
 25
25
 26
26
 27
27
 28
28
 29
29
 30
30
 31
31
 32
32
 33
33
 34
34
 35
35
 36
36
 37
37
 38
38
 39
39
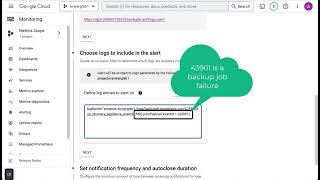 40
40
 41
41
 42
42
 43
43
 44
44
 45
45
 46
46
 47
47
 48
48
 49
49
 50
50
 51
51
 52
52
 53
53
 54
54
 55
55
 56
56
 57
57
 58
58
 59
59
 60
60

Top 3 ways organizations are adjusting their cloud strategies to prepare for economic uncertainty
Google Cloud
Google Cloud Retail Search and Browse Console deep dive
Google Cloud
Google Cloud Backup and DR - How to mount, clone or restore a VMware VM
Google Cloud
Google Cloud Backup and DR - VMware vSphere Backup Overview
Google Cloud
Google Cloud Backup and DR - Creating backup Plans for VMware VM backups
Google Cloud
Google Cloud Backup and DR - Compute Engine Instance Backups and Sole Tenant Nodes
Google Cloud
Google Cloud Backup and DR - Managing Service Accounts
Google Cloud
Let’s solve for what’s next
Google Cloud
Google Cloud Executive Briefing Center | Cloud Space | Silicon Valley
Google Cloud
Tinyclues with Google Cloud offers CRM Intelligence to maximize conversions
Google Cloud
Aible partners with Google Cloud helping customers build predictive models within minutes
Google Cloud
TELUS streamlines big data ingestion with help from Google Cloud and Accenture
Google Cloud
Getting started with Apigee API Management
Google Cloud
Google Cloud Retail Search
Google Cloud
Building your first API proxy with Apigee
Google Cloud
Brands and agencies develop dynamic video ads with Connected-Stories NEXT and Google Cloud
Google Cloud
Redefining the transportation industry
Google Cloud
Google Cloud Project Katalyst
Google Cloud
Israel's Family Court: Creating more compelling experiences for its citizens
Google Cloud
Tausight partners with Google Cloud to help healthcare industry protect PHI activity & take action
Google Cloud
Google Cloud Retail Browse
Google Cloud
Verifying API keys and debugging your API proxy flow
Google Cloud
Getting started with Apigee API Management
Google Cloud
Adding policies to your APIs
Google Cloud
Google Cloud Backup and DR - Configuring Google Cloud VMware Engine to work with Backup and DR
Google Cloud
Topaz Subsea Cable
Google Cloud
Episode 29: Building a culture of data literacy with Latin America’s biggest ecommerce platform
Google Cloud
Weshalb Datananalysten die Sparringspartner von Produktmanagern sein sollten
Google Cloud
Warum und wie METRO eine Machine Learning-Pipeline implementiert hat
Google Cloud
Wie nutzt METRO Data Science, um geschäftliche Herausforderungen zu meistern?
Google Cloud
Google Cloud in Qatar. Let's get solving.
Google Cloud
Google Cloud for Qatar
Google Cloud
Doha has a new Google Cloud region
Google Cloud
The new Google Cloud region in Qatar
Google Cloud
Build, tune, and deploy foundation models with Vertex AI
Google Cloud
Generative AI on Google Cloud
Google Cloud
Who will be coming to Google Cloud Day Tel Aviv? #Shorts
Google Cloud
Protect your organization at the edge
Google Cloud
Google Cloud Backup and DR Alert Notifications setup
Google Cloud
Build, tune, and deploy foundation models with Generative AI Support in Vertex AI
Google Cloud
Where the Internet Lives: Data center on the prairie
Google Cloud
Which developer program are you joining?
Google Cloud
Lufthansa Group baut intelligente Systeme zur Vereinfachung des Flugbetriebs
Google Cloud
How ASML revived Moore's Law and remade chipmaking
Google Cloud
CMO of Unity celebrates Women's History Month
Google Cloud
Vint Cerf on Google Cloud Digital Leader
Google Cloud
Mobile World Congress 2023
Google Cloud
Topaz - Canada
Google Cloud
Google Data Cloud & AI Summit 2023: Reveal opportunities to transform your business
Google Cloud
Building a conversational bot with Google Cloud Gen App Builder
Google Cloud
Elisa Polystar and Google Cloud partner to bring the power of analytics and automation to CSPs
Google Cloud
Network modernization - how can CSPs start now?
Google Cloud
How Semios uses imported and remote models for inference with BigQuery ML
Google Cloud
Deliver your AI solutions up to 100 times faster with Google Cloud partner, Snorkel AI
Google Cloud
Capture consumer perspectives for CPG using NLP and analytics with Harmonya and Google Cloud
Google Cloud
Delivering Cloud-Native Network Transformation
Google Cloud
Proactively detect & investigate anomalies & data quality issues in BigQuery with Telmai
Google Cloud
Introducing AlloyDB Omni
Google Cloud
Episode 30: How Auto Trader transitioned to the cloud to analyze tricky customer data
Google Cloud
MongoDB Atlas on Google Cloud
Google Cloud
More on: Data Literacy
View skill →









Related Reads
📰
📰
📰
📰
Exploring Data the Right Way: A Practical Walkthrough of the CRISP-DM Data Understanding Phase
Medium · Data Science
Exploring Data the Right Way: A Practical Walkthrough of the CRISP-DM Data Understanding Phase
Medium · Programming
Exploring Data the Right Way: A Practical Walkthrough of the CRISP-DM Data Understanding Phase
Medium · Python
What Hiring Managers Actually Think When They See Your Data Science GitHub in 2026
Medium · Machine Learning
Chapters (26)
Introduction to course 3
2:00
Alyx: Data analysts help others learn from data
2:33
Welcome to module 1
3:39
Stages of the data journey
6:17
Steps for effective data collection
8:13
The process stage ensures clean and consistent data
10:39
Manual and automated transformation
13:36
Module 1 Wrap-up
14:15
Welcome to module 2
15:13
Data pipelines in the cloud
18:14
Alyssa: Improve systems by collecting data and asking questions
20:49
The difference between ELT and ETL
24:53
Data ingestion methods that suit your needs
29:03
Data mapping helps ensure consistent data
32:47
Introduction to profiling and cleaning data
35:21
Common ways to manipulate data
38:50
Different approaches to loading data
42:19
Overview of data validation strategies and rules
46:04
Module 2 Wrap-up
47:11
Welcome to module 3
48:23
Challenges of data transformation
52:37
Data aggregation can make it easier to extract meaningful insights
55:56
Consequences of duplicate data and how to eliminate it
59:39
Overview of how joins combine data from different tables
1:03:15
Data derivation to combine data and obtain new insights
1:07:21
Mod
🎓
Tutor Explanation

 DeepCamp AI