Data Management and Storage in the Cloud | Google Cloud Data Analytics Certificate
Skills:
Data Literacy90%
Key Takeaways
Data Management and Storage in the Cloud using Google Cloud Data Analytics Certificate
Full Transcript
[Music] hello data Enthusiast I'm so happy to welcome you to this course about cloud storage and data management in the cloud my name is Eric and I work as a product Analyst at Google I began my career as a recruiter in Aerospace where I aim to quantify what attributes set apart especially great job candidates I've since worked across several industries from Aerospace to entertainment to Tech and across several departments from recruiting to real estate to product across all of these experien es the importance of data infrastructure has been a through line deriving insights from a data set fundamentally requires that data to be organized and accessible I can't wait to share more and help guide you through the next series of topics all about how data is structured and organized you're about to gain tons of practical experience in data organization which means you'll be equipped to establish a plan that ensures you can find the data you need in a useful format anytime you need it you'll examine data lakeh house architecture which as you know is not how you build a house on a lake but an effective way to store process and analyze vast amounts of data here's the breakdown you'll start with data storage data connections data types and data structures then you'll move on to table schemas along with batch and streaming data processing next you'll explore denormalized data data governance metadata data cataloges the key components of of data Lakehouse architecture and more then you'll discover the data Plex and how it can be used to identify data sources in big query you'll learn to identify and Trace data sources and how to access data libraries finally you'll explore data reference architectures how to manage tables in big query add and export data and query tables you'll learn to access data from Google cloud services and manage a data proc cluster then you'll explore the benefits of data partitioning these lessons are specifically designed to give you a solid foundation in organizing and structuring data which any employer will appreciate you've made a great start in your journey as a data analyst so far but we've got lots more fun ahead let's keep the momentum up and move on hey there are you ready to get moving and by that I mean get data moving of course this module will get you into how data moves within and across systems will identify different types of data their appropriate storage structures and various data extraction methods including ways to transfer data between systems the first topic you'll explore is modern data architectures after that you'll review the concept of a data lake house and examine its benefits and challenges next you'll consider the different data types highlighting their key characteristics and considerations finally you'll gather essential techniques and strategies for handling both batch and streaming data data sources you'll then be able to effectively manage and process data in diverse systems I can't wait to help you start this journey hi I'm Eric here at Google I'm a product analyst focused on Google's technical infrastructure this means that I help Google use the many machines across its dat of warehouses as efficiently as possible in other words I improve the stuff that helps run search Gmail and every other Google product I'm a excited to help you ramp up your analytics skills the vast majority of my analytics and data science skills are self-taught my educational background is actually in Psychology and communication I began my career in recruiting I supported an internship program for a space company and represented that company at Career Fairs across the organization ultimately I recognized that to recruit efficiently was actually an analytics problem I needed to quantify HR data to answer questions like what is most predictive of a candidate's success and what factors most contribute to an interns employment satisfaction I ultimately learned mostly via searching online optimal ways to measure and present that information fortunately analytics techniques are often shared across many departments and industries this has allowed me to bounce between Industries like Aerospace entertainment and Tech and departments like HR Real Estate finance and product these experiences and enabled me to recognize how analytics Concepts translate across business contexts I started my analytics career with a social sciences undergrad degree while statistics and computer science degrees are certainly helpful they're not necessary if you're hungry enough to learn on your own as people work to grow in the cloud data analytics space there are a few things that were helpful for me that I recommend first start with clean data and insight is only as valid as the data it's derived from from before you start make sure your data sources are correct and accurately represent the big picture also while we work with numbers analytics is really about storytelling don't just focus on the numbers Focus how to communicate those numbers such that folks understand what they mean and how to respond picture this you're lounging scrolling your favorite website and then bam you notice an ad for a product you've never thought about before but now you have to have it you know something that exactly matches your interest and style like a tea kettle disguised as a house plant how did they know most likely a business has tracked data related to your past purchases to send you ads offers and coupons that will make sure you come back again and again it can be mindboggling to consider how perfectly an ad figured out what you personally would like now say you work as a data analyst for a company that has millions of different customers that company needs to know a lot about their customers likes and needs to recommend the right product for each customer how can companies manage all this data and how do they handle multiple sources and formats a key piece is data storage and how data is connected across systems and that's what we're going to explore in this video cloud data storage is a solution that enables organizations to keep access and maintain Digital Data in off-site cloud-based servers that they don't need to own or manage the data can include files business data videos images and tons more in the context of these data storage tasks data analysts generally focus on input and output data input data is any information that a user sends to a computer like the text you type into a document the information you enter when filling out an online form or an image you scan with a scanner conversely output data is information that a computer sends to a user some examples include a spreadsheet outputting a pie chart or a photo editing program outputting a PDF or an online store outputting a sales receipt or order summary data storage systems can be used to store both input and output data some common storage systems you might want to connect in order to access data might be systems of record transactional databases and cloud storage a system of record is a data storage system that serves as the source of Truth for an organization's data related to processes or systems this includes any proprietary information and data used to maintain compliance all of the data associated with these systems is uniform in a system of record the system of record is the authoritative data source for data related to the process or system which it supports next are transactional databases a transactional database is a data storage system which stores each transaction or interaction and their fields as individual rows transactional databases are common in e-commerce online banking and other businesses that may record customer transactions a transactional database can also be one of your systems of record for example imagine you work for a company that sells clothing and equipment for outdoor enthusiasts each time a customer purchases a pair of hiking boots a new row is created in your transactional database the row contains the customer name the inventory name of the boots the date of the purchase and the sales price all of the rows together make up the transactional database that's a mountain of data finally there's cloud data storage which is a solution that enables organizations to keep access and maintain Digital Data on off-site cloud-based servers a cloud provider hosts and securely stores the data making making it easily scalable when you need to increase or decrease capacity so it's very likely that you'll be working with multiple sources of data in your Cloud career and to make sure that all of that data can work together you'll want to be able to connect to all of your data sources a data connection is a link formed between a data source and another tool in order to access the data source from the tool in order to view and interact with your data you will want to work with a tool that allows you to easily connect to all of your data systems from a single place usually this is a business intelligence or Analytics tool from which you want to be able to connect to all of your business's data in order to create dashboards reports pivot tables or other types of analysis these tools provide data connectors to let you access the data you might have in transactional databases cloud storage or other storage systems now you know the essential tools you'll use to gather store and access data and you've learned how data connections help keep everything working smoothly together with this knowhow you'll be ready to find and transport your well organized data I think data analytics has a profound impact on the world I think It ultimately helps us to truly capitalize on the potential that digitization has and really helps us getting to a better more quitable more sustainable World hey I'm Garrett I'm the head of data analytics at Google and I'm Building Services that process and analyzes large amounts of data data analytics is really about helping our customers to unlock the value from the data that they are having so you can think about data like all of those secrets and hidden patterns that surround us every day we want our customers to be able to understand them see them and ultimately harness them to drive business value for them improve their customer experience or ultimately just take better decisions quicker the beginning of of my career was in software development I started as a junior software developer in a database development team and um learned um from the very first lines of code that data processing systems are awesome I studied computer science um at at College yes one of the biggest lessons though of my life is that you know learning is not an institution you know learning is an attitude when you are at work that of course you know doing your job but also having an interest in all of the areas outside of it and trying really to get a very broad skills profile because you know once you press in your career you really draw on the breath of your experiences on the breath of your knowledge much more than on something that you have deeply specialized so I think there is a a big opportunity in in learning broadly and wildly even outside of the regular career and work paths I think the most important part is to really appreciate learning and appreciate what learning is you know learning is not applying learning is not being proficient you know learning can be very frustrating actually and it's a it's hard but once you understand that it's a hard and reward Ing and um sometimes you know lengthy process and accept that you can make it I think really a part of of your life and of your life experience in a very positive way data analytics and Cloud really go hand in hand data is vast there is no limit that you know we conceive to how big data can get it's being generated every day it's generated in increasing rates and the cloud actually provides the capacity it provides the systems that actually can store and process these best amounts of data in an efficient and even in a in a in a conceivable way so you you do need both right you do need to have the digitization of everything and you need the cloud as the foundational infrastructure to process that data so I think rather than limiting to I want to learn one language or I want to learn one technology stack I would really recommend learning and appreciating the breath of Google's Cloud feeling unprepared is part of the journey to growth I think it's quite normal to feel unprepared or overwhelmed when you get into a new job or into a new opportunity you know it's I think what everyone experiences what I have experienced all throughout my career and it's really the trigger point right it's basically telling you that hey here's something interesting here's something new to learn once you appreciate for what it is you know really growing yourself um it it kind of you know gets gets real fun and exciting hi there it's great to have you here thanks for joining me in this video about getting data organized this is a really important topic not just because data organization is a big part of the data profession it will help you be more time Savvy too how much data are we talking an astounding 2.5 quintillion bytes of data that's 2.5 billion gigabytes or to help you comprehend this better that's roughly 10 million laptops worth of storage space generated globally per day wow it's no surprise that effective data organization is so valued by analysts and organizations all right let's begin exploring the different types of data storage tools these include relational databases data warehouse data Marts CSV file and data Lake each of these has benefits and drawbacks depending on the type of data being stored so as a data analyst it's helpful to understand which option is best for whatever type of data project you're working on first relational databases a relational database is a database that contains a series of tables that can be connected to form relationships relational databases are frequently used in businesses of all sizes to manage their data because they allow users to perform complex queries on data from multiple tables all at the same time then there is the data warehouse the data warehouse is a database that consolidates data from multiple Source systems for data consistency accuracy and efficient access they're optimized for analytical queries making them ideal for organizations that require complex data analysis next up the data Mart the data Mart is a subject-oriented database that can be a subset of a larger data warehouse being subject oriented just means that it's associated with a specific area of Interest or Department of a business this makes data Mars useful for business intelligence and Reporting because they provide easy access to specific data subsets next is the CSV which stands for comma separated values a CSV file is a delimited text file that uses a comma to separate field values while CSV files are simple ways to store tabular data like in a spreadsheet they lack scalability and are ineffective when working with large or complex data sets finally the data Lake the data lake is a database system that stores large amounts of raw data in its original format until it's needed data Lakes are a versatile solution when you're working with diverse sources and data types data Lakes allow you to process data without restriction to size and format but no matter what data you encounter managing and storing it effectively is crucial to making sense of it and to make smart data driven decisions welcome back data devotees today we'll start with discussing a crucial part of your data career the main ways in which data is stored these include structured semi-structured and unstructured data being able to recognize these three main ways of storing data will set you up for Success when it comes to finding and querying the right data for each particular project you work on okay let's start with some definitions then we'll take a deeper dive into how to store different types of data structured data is data organized in a certain format like rows and columns for example you might find structured data in a table or a spreadsheet this makes it easy to understand and process by computers structured data is easily stored in traditional databases like a SQL database one of the essential features of a SQL database is its ability to establish relationships among tables for two tables to have a relationship one or more of the same column must exist inside both tables these columns are called keys there are two types of keys a primary key and a foreign key each table has a primary key which is an identifier that references a column in which each value is unique you can think of a primary key as a unique identif fire for each row in the table as an analyst you may need to create tables if you do decide to include a primary key it should be unique meaning no two rows can have the same primary key also it cannot be null or blank there are also foreign Keys a foreign key is a column within a table that is a primary key in another table for example a foreign key is how one table can be connected to another that's what makes it possible to establish the relationships among tables Pro tip it's important to keep in mind that more than one foreign key is allowed to exist in a table with these Keys users can combine data across multiple tables and query them simultaneously making it easier to analyze complex relationships and gain valuable Data Insights next let's check out semi-structured and unstructured data unstructured data is data that is not organized in any easily identifiable way it lacks predefined structure and can include text images videos and more examples of unstructured data include social media posts and audio recordings unstructured data is valuable because it can be used for such a wide variety of purposes even though it's more challenging to process and interpret for example cloud-based data Lakes are well suited to unstructured data some of these tools include Google Cloud Storage or GCS and Google cloud data proc they don't require a fixed schema instead they store data as documents or files and this can include any number of fields and nested data structures or no structure whatsoever this allows a data analyst to quickly store search retrieve and analyze data as needed no matter the data format it's also easier to modify the data without impacting the application imagine a social media app if the user posts a text caption along with a video both the text and video file are examples of unstructured data that cannot be mapped to a pre- defriend structure since they could contain anything finally now that you have an understanding of structured and unstructured data let's move on to semi-structured data semi-structured data is data that has some structure but is not as precisely organized as structured data this means it's more flexible than structured data which makes it great for storing data that might not fit into a traditional table or spreadsheet format one common example of semi-structured data is email email messages have a header that contains structured data such as the sender and recipient names subject date and time this structured data makes it easy to find and store email messages but the body of the email is unstructured and can contain a variety of data types including text of various lengths images links and attachments this makes emails flexible and easy to use for a range of tasks in your data career you'll come across tons of different data sources they're the true foundation of any datadriven decision-making process and that's why it's crucial to be able to recognize the various data structures so you can determine the best way to get that data moving great work tackling this important topic in the early days of data analytics as businesses started collecting and analyzing large amounts of data the term data warehouse emerged to describe the architectural concept used to store and organize this data the analogy of a warehouse illustrates the idea of a centralized structured and organized storage space where a data analyst can efficiently manage data and make it accessible for analysis then as businesses accumulated vast amounts of data from various sources including unstructured and semi-structured data like text documents images videos social media posts and sensor data traditional data warehouses face challenges in efficiently storing and processing this data to address these limitations and accommodate the diverse and rapidly growing data the concept of a data Lake emerged in this video you'll explore an example of a data lake house and witness just one way they're revolutionizing the way data is managed and analyzed a data lake house is a hybrid data architecture that combines the features of a data Lake and those of a data warehouse this creates a ified platform for storing processing and analyzing vast amounts of structured and unstructured data from diverse sources by leveraging the strengths of both data warehouses and data Lakes a data lake house offers improved data management capabilities seamless integration with analytics tools scalability and the flexibility to efficiently handle various workloads let's examine this with a business example from an agricultural company the business has a data infrastructure which includes includes an on-site data warehouse and a cloud-based data Lake hosting data in separate infrastructures is hindering the ability to adapt to changing business needs and extract timely insights to potentially resolve the issue the data analytics teams wants to migrate to a data lakeh house they initiate a comprehensive migration plan it begins with assessing their existing data infrastructure and identifying any pain points in bottlenecks it turns out that their traditional data warehouse is struggling to handle the growing data volumes in diverse data types there are Json documents supplier call recordings and free text from vendor and partner surveys storing and processing hundreds of terabytes of data is going very slowly and sometimes overwhelms the servers to the point of crashing or breaking the system at the same time the company's data Lake lacks the necessary structure and governance mechanisms data analysts are struggling to understand if the data has quality issues like blank fields and product categories that don't match other tables data Discovery integration and quality control are significant challenges impeding efficient data analysis and decision-making the company's data team then implements the data Lakehouse to unlock the true potential of their data now they can store and process data in its raw unaltered form while providing necessary structure and organization for efficient analysis plus they can scale resources on demand ensuring Optimal Performance during Peak data processing periods the data Lakehouse also addresses their data governance concerns with defined data schemas access controls and security measures they establish strict policies andhere to compliance requirements things are going so well that the company decides to take it a step further and tap into the Cloud's analytical capabilities they integrate Advanced analytics and machine learning tools into their data Lakehouse architecture enabling them to uncover hidden pattern patterns perform predictive modeling and generate actionable insights their data scientists and analysts explore vast amounts of data experiment with different algorithms and drive Innovation this company now enjoys significantly better agility when creating reports dashboards and queries teams can respond more quickly to Market changes and customer demands and the enhanced data government framework instills confidence in their stakeholders ensuring the privacy and security of sensitive information through the Strategic move to a data lake house from a data warehouse the company has harnessed the full potential of its data and empowered its people and now you're empowered with the knowledge of data lake houses great work schemas are powerful tools that help people make sense of the world schemas provide a way of describing how something is organized and people use them constantly usually without even knowing it for example you may use a schema when planning to visit a a new Museum the schema for a museum might include a description of the different types of art on the display the size of the museum the entry fee and the location all of this information can help you to understand what to expect when you get there schemas are also an essential part of understanding tables in this video you'll explore table schemas with big query there are several parts of a table schema that provide important information essential for understanding a table and its columns the column name the data type and the mode Let's explore each one first we'll start with the column name each column in a big query table has a unique identifier called the column name you use column names to refer to columns in queries and access the data in the columns column names can contain letters numbers and underscores and they must start with a letter or underscore it is also important that each column name is unique this means that each column name needs to be different from other column names so that the columns are easy to find and use next let's move on to the data type the data type of a column specifies the kind of data that can be stored in the column for example a column with a data type of string can store text Data while a column with a data type of integer can store numeric data the exact data types you can use will depend on your Cloud tool big query supports a wide range of data types including numbers strings date and time location time interval Json objects struct and array number types can be used to store numeric data which is any data that can be represented as a number this includes integers floating Point numbers and decimals common number types are numeric integer and Float 64 string types in big query can be used to store any quence of characters including text Data such as names addresses and phone numbers as strings as well as binary data as bytes while number and strings are the most common there are other data types you can use in big query date and time types like date and date time can be used to store date and time data such as order dates and shipping times location types like geography can be used to store Geographic coordinates such as latitude and longitude time interval types like interval can be used to store periods of times such as how long it took to fulfill an order or how long a customer was on the phone with support big query also has two main complex data types arrays and structs arrays are called repeated columns in big query which means they can store multiple values of the same data type in the same column structs are called records and they can store multiple values of different data types in the same column in big query you can also use Json Json objects can be used to store key value pairs of data now let's discuss the mode the mode is another important part of a schema the mode tells you whether a column can contain empty values a nullable column can contain empty values while a required column cannot mode is also important because you can turn a column into an array by setting the mode to repeat it by looking at the column names data types and mode for each column in a schema you can learn how the data in the table is structured this will help you write queries group data create tables and share the data with others keep practicing using big query to explore table schemas and how they organized data into logical groups to streamline your workflows you're well on your way to becoming a big query schema data Pro hello data virtuoso thanks so much for being here to learn about nested data structures understanding the concept of nested data is super important to the field of data analytics the good news is that you likely already have a basic understanding of something that's nested have you ever reviewed a company's organizational chart in this nested structure the company is the main object or structure and the Departments are the substructures contained within it those departments further subdivide into teams and the teams further subdivide into individual employees a website is another everyday example the homepage is the main object with the other Pages being the substructures each page further subdivides into sections and the sections further subdivide into different types of content similarly a nested data structure is a structure that organizes data within other data structures forming a hierarchy of information they provide a highly effective way to store process and retrieve information this allows a data analyst to ensure data integrity and facilitate efficient data management nested data also plays a major role in representing complex associations like parent child relationships or multi-level categorizations by nesting data it's possible to capture these Connections in dependencies enabling more Advanced Data analysis there are various types of nested data used in data processing but not all tools support all data structures two common data structures used in for nested data include struct and arrays a struct is a way to group multiple columns together a struct is called a record in big query this is useful when you want to organize data that is part of a common thing for example imagine you have a group of columns that each contain one important piece of information about a customer's address to group this data together you can use a struct called address in this address struct you can Nest the related columns like the first or second line of the address the city name state or Province postal code and Country by grouping the related columns together in a single column using a struct you can make it easier to find and query the customer data an array is a list that contains values of the same data data type an array is called repeated in big query arrays can be used to store a range of data types such as numbers strings strs or even other arrays when you use an array you can store an entire list of data in a single column as long as they are of the same data type for example you can use an array to store a list of email addresses from a customer in one place arrays can even store nested data an array of strs is a list of strs stored in a single column this is especially useful for storing lists of complex repeated items such as different addresses for example each customer may have multiple addresses for different purposes such as shipping billing home and work addresses by grouping all customer addresses together in an array of structs you can keep all the customers's address information organized and easier to access when query each type of nested data has its unique characteristics and use cases providing versatile tools to manage and analyze complex data sets additionally patterns within the data like reoccurring structures or hierarchical relationships can help you decide when using a nested data structure may help make it easier to work with the data now that you can identify nested data structures you can start to understand how the different parts of the data relate to each other this is important because querying nested data is different from querying regular columns to write queries that work with nested data you need to know how to recognize nested structures and how the nested data elements work just like a business's organizational chart helps you locate where your data team members fit in the organization and a website homepage links to its many pages to help you find the content you need you can identify and understand nested data structures to help you pinpoint the right information imagine observing from the rooftop of a building the intersection of two bustling roads one represents the world of batch data where information is collected processed and then delivered in regular steady intervals just like the cars waiting at the light before zooming down the road batch processing enables data professionals to collect large volumes of data over a period of time and then process it all at once the other Road represents the fast-paced streaming data streaming data is processed right when it's received like the constant flow of traffic now please ride along with me on this road trip to catch the sights of the fascinating landscape of batch and streaming data let's begin with batch processing batch processing is a method of collecting large volumes of data over a period of time and then processing all of it at once batch processing uses various data sources and each has their own characteristics and advantages the most common formats include CSV or comma separated values found in spreadsheets and many types of databases Json or JavaScript object notation which provides easyto read representation of complex data structures and park a columnar storage format for quick compression and improved query performance the frequency of batch data processing varies based on the specific use case ranging from hourly to daily to weekly and Beyond now on the other hand streaming data processing is a method of processing data as it's received it might come from a device in the internet of things or iot a social media feed and more the frequency of streaming data processing is typically in real time or near Real Time with streaming data you'll encounter file formats and systems specifically designed to handle velocity and Agility one is Avo which is a file format that helps programs understand and share data using schemas and seamless handling of data structure changes there's Apache Kafka an open- Source distributed event streaming platform that allows you to publish subscribe store and process streams of Records this is particularly useful for building data pipelines and applications that require handling large amounts of data and finally there's Apache nii an open source data integration and data flow automation tool which is particularly useful for collecting transforming and moving large volumes of data both batch and streaming data processing have advantages and disadvantages depending on the use case batch processing is great for handling large volumes of data efficiently like in data warehousing and analytics it also enables organizations to perform complex analytical operations like aggregations Transformations and statistical calculations on huge data sets and it provides the necessary time window to process historical data and generate insights for long-term planning and decision-making however it takes time to generate these insights conversely streaming data processing is instrumental in near realtime analytics and monitoring scenarios where timely insights in continuous monitoring are vital organizations use it to monitor live data streams to detect anomalies trends or critical events in near real time streaming data processing supports implementing alert systems and triggers actions based on predefined conditions enabling companies to respond swiftly to new situations however handling streaming data is often more complex and expensive selecting the right data processing Paradigm is a critical decision that affects data processing efficiency and compatibility to make the best choice consider factors like d data requirements and data characteristics processing speed and latency constraints and integration capabilities with existing systems as a cloud data professional it's crucial to evaluate the pros and cons of each format in different scenarios to make informed decisions about data processing strategies with this understanding you've now got what it takes to enhance your organization's data processing efficiency and navigate with a tank full of potential data wow you've come to the end of this section all about data types organization methods and how data moves you've learned a lot of valuable information that will be incredibly useful as you continue on your path in the cloud data profession you began this section exploring data storage and connections Plus data types and structures you then moved on to table schemas and data processing methods you were introduced to the concept of a data lake house uncovering its advantages and challenges and you investigate ated important aspects of modern data architectures giving you an overview of the entire data transformation process there have also been many new terms and definitions in this section of the course be sure to check out the glossery to make sure you are comfortable and confident with these Concepts thanks for joining me you've got this hey there and welcome to another exciting section of the program I'm really excited to dive deeper into more ways you as a data professional can build your skills you'll start by learning more about key elements of normalized and denormalized data next you'll explore data governance Technical and business metadata and master data management then you'll check out data cataloges in their different components and types finally you'll spend a bit more time with data lake houses and get some great tips for implementation there's a lot to cover and all of it specifically designed to give you a comprehensive understanding of data organization best practices after completing these lessons you'll be able to easily Define your role in both data organization and the entire data life cycle let's get started hey there data fan thanks for joining me for an in-depth examination of denormalized data you're about to learn some common denormalization techniques but don't worry this examination has no wrong answers but first let's understand normalized data normalization organizes related fields into different tables and maintains defined relationships between columns in these different tables for example one table can hold data related to employee information like employee ID employee name manager ID and so on meanwhile another table can contain information about the department they work in we can join these two tables together using the manager ID when data is normalized like this it's generally easier to avoid duplicate data and inconsistencies and apply updates on the other hand denormalized data stores repeated information in one or more tables denormalized data is ideal for gathering information quickly it reduces overall complexity and it creates the ability to scale quickly but denormalized data has disadvantages like duplicated data increase storage needs and the potential for inconsistencies there are different ways to denormalize data which improves query performance the most common way is to add duplicate columns in each table then a data analyst doesn't need to join the tables themselves other methods are to split tables into smaller ones that only have rows or columns that each application needs mirror Tables by making copies of tables for easier reading or create summary tables that hold ready-made totals like counts or a averages so the company can consider their options on how to structure the data and whether to move from normalized to denormalized based on the business goals this may include additional application features how fast the data team needs to retrieve data and the different ways the data team uses the data our modern world is a wash in data it's everywhere we look from the news feeds we read to the websites we visit this data can lead to incredible business outcomes but it can also be overwhelming and difficult to manage if companies aren't careful they can easily get lost swimming in a sea of Stormy data to prepare you to navigate these complex Waters this video will explain data governance this is a process for ensuring the formal management of a company's data it helps organizations maintain data accuracy reliability and security data governance can consists of several essential elements that work in concert these are data policies and standards data quality management data privacy and security and data stewardship and ownership let's check these out data policies and standards Define the rules guidelines and procedures for data management within an organization they establish the expectations for data handling use and sharing ensuring consistency and adherence to best practices next data quality management focuses on maintaining the accuracy completeness consistency and reliability of data it involves processes for data cleaning validation and ongoing monitoring to ensure that data meets predefined quality standards continuing on data privacy and security are critical aspects of data governance activities here include implementing security protocols access controls and compliance with data protection laws and lastly data stewardship and ownership involves the assignment of roles and responsibilities for data management and oversight it ensures that there are designated individuals or teams responsible for data governance activities data governance aims to achieve several important goals which Drive the effective management and use of data within an organization first it helps achieve data integrity and accuracy throughout the data life cycle by implementing data quality quity controls and validation processes organizations can ensure that data is trustworthy and reliable with the increasing number of data protection regulations data governance also plays a crucial role in compliance this enables organizations to establish policies and practices that align with regulations and protect privacy rights another key objective is to make data more accessible and usable for authorized users this is made possible possible by implementing proper data classification access controls and metadata management and data governance provides a foundation for making informed decisions based on reliable timely and accurate data by enhancing the quality and integrity of their data companies can realize more reliable insights and informed decision-making this also leads to more robust security measures reducing the risk of data breaches and privacy violations this builds trust and can help protect the organization's reputation with proper data governance organizations can establish a culture of trust and credibility in their datadriven initiatives and finally data governance streamlines data management processes reducing redundancies and inefficiencies this leads to improved organizational efficiency and Effectiveness when using data as a strategic asset maintaining data governance so that it stays on the right track is key ke to an organization's growth and success so let's go through a quick suggested stepbystep guide on how to implement data governance to begin set clear goals and objectives for a data governance project then get support from Top leaders in the organization after that put together a data governance team with representatives from different departments like it legal finance and operations next clearly define the role R and responsibilities of the data management team and ensure that they know and understand them finally create a data governance plan that includes policies procedures standards and guidelines for data management once the data governance plan is created it's time to invest in tools and technologies that will help automate and streamline data management processes train the data management team on how to use these tools and follow best practices keep track of how well the data governance plan is working with key performance indicators or kpis also promote a datadriven culture where everyone values data and shares insights and the processes policies and Technologies used in the data governance plan should grow and evolve with the organization and that's it for an overview of data governance the ability to manage data assets is an essential skill for every data professional the strategies you learned in this video will enable you to navigate a sea of data in your future role as a cloud data professional I was a special agent in the Federal Bureau of Investigation for 22 years it was during that time in the FBI where I was assigned an investigation that included a cyber security element to it and that's what I would call my Pivot moment that really was the deciding factor for me I need to invest time Cycles develop my intell Ence on this take courses do whatever I need to do in order to get smart on it my name is MK Palmore I'm a director in the office of the ceso for Google cloud my team is responsible for helping customers on board safely and securely into the cloud I'm a child of the 80s and for those of us and Gen X that come from that generation everything in the 80s was really about um the opening of the door to All Things computers even families that like mine that were socially and economically disadvantaged we even had opportunities to Avail ourselves of computers and Computing technology and so this interest in Computing and and what it might evolve into I think the seeds were planted cyber secur is important in a cloud first world because cyber security is the number one topic for business Enterprise risk I made a a pointed decision uh on my own to change my career path and begin investing in the opportunity to learn and become educated in cyber security the skill that I think is most important for cyber security practitioners is a willingness to understand that you don't know everything I'm a huge supporter of certificate programs certifications in the industry uh because that is the pathway that I took in order to get educated I feel that the more training that we can make available to a wider audience to give folks that opportunity to get educated in this field I just think the better off we're all going to be cloud is probably the most exciting industry to be in right now because the possibilities I think are endless the benefits of cloud to business to individuals to society overall I think that that trajectory is still on an upward upward Arc so when you combine cloud with cyber security uh and you think about it in terms of the availability of jobs and the job market this is a market that will continue to expand for years to come picture a data analytics team at a construction company every analyst has access to the organization's main database but some employees require keeping data sets stored on their local hard drives because they do not always have the online access to the data sets unfortunately when new data streams in about engineering plans or updates are made to their Lumber and conrete inventory records those employees with locally stored data sets will not have the updated in ventory information so over time data sets will become outdated and error prone and when team members share Data Insights with stakeholders there is a risk that results won't line up with what other analysts communicated this business needs help it's time for the data team to prioritize having a single source of truth and that's made possible through Master data management Master data management or MDM is a discipline and framework for managing and maintaining critical data Assets in order to achieve a single consistent view of data across the organization these critical data assets also known as Master data include core entities like users products locations and employees there are four key components that work together to ensure effective MDM the first is data governance which is a process for ensuring the formal management of a company's data assets data governance establishes policies standards and guidelines for data management it defines roles responsibilities and processes to ensure data Integrity security and compliance second data integration describes incorporating Master data through different systems and applications it ensures that data flows harmoniously allowing different departments and systems to access and use up-to-date information and a single source of Truth next data quality management focuses on maintaining and improving the accuracy completeness and consistency of Master data it involves data cleaning validation and enrichment to ensure that data meets predefined quality standards and lastly data stewardship assigns responsibilities for data ownership maintenance and governance data stewards are accountable for ensuring data accuracy resolving data related issues and promoting data governance best practices MDM offers many essential business benefits first it improves data quality by establishing standardized rules processes and controls for data management it ensures consistency in how data is captured stored maintained across systems eliminating duplicate or conflicting information with MDM you can trust your data is accurate upto-date and consistent second it empowers datadriven decision- making by providing a holistic and complete view of Master data having this accurate consistent and reliable information brings about well-informed decisions that drive business growth and competitive Advantage maybe most importantly MDM creates that single source of Truth it eliminates data silos and discrepancies like the ones happening at the construction company by synchronizing data across systems everyone accesses the newest most accurate and most reliable information this leads to improved operational efficiency because employees can rely on the data they work with likewise by streamlining data management processes and eliminating redundancies MDM saves effort money and time spent on costly mistakes rework reconciliation and manual data entry by implementing and supporting a master data management framework at your organization you'll help your employer boost data quality and consistency enhance accuracy increase operational efficiency and improve the bottom line and that's the truth hello there data fans in a world where every click or tap leaves a data footprint at a website store and a website visitor shares content like photos and video clips an organization can end up collecting a vast amount of data to keep track of this doesn't even include the internal data and organization of masses like structured and unstructured data reports and more in this video you'll learn all about data catalog a valuable tool for organizing data and getting data analysts on the right path to amazing insights a data catalog is a centralized inventory of an organization's data assets think of it like a compass guiding users through the data landscape and helping them Reach the data sets and informations they need it provides a comprehens ensive view of available data enabling users to easily discover understand and use data assets this level of visibility and accessibility is the foundation of efficient and effective data management this means that all of the data your organization owns can be cataloged making it easy to search and to find the exact piece of data you need let's say you work as a data analyst for a sports team your data catalog will include structured data un structure data reports dashboards and visualizations and any Automation and machine learning models you have created what does this mean for how the sports team's management builds and grows the team and tracks the data they collect for each player structured data includes all statistics on player performance collected over the team's history unstructured data includes all the news articles photos social media content and video clips captured by the organization reports may include payroll reports and player performance reports while dashboards and visualizations may Focus specifically on player performance finally automations and machine learning models include attempts to make predictions about player performance you have an incredible amount of data at your fingertips and you would love a way to be able to search it all and build a profile for each individual player a data catalog can help you make this search possible let's explore the key elements of a data catalog that make a data catalog an essential tool for any data driven organization one of the key elements of a data catalog is metadata metadata or data about data is a key to unlocking the data's True Value and data cataloges enable metadata management by organizing and storing important details about the data sets data cataloges also enable organizations to track the origin and transformation of data ensuring reliability and accuracy with the data lineage information supported by data catalogs users follow the Journey of data identify any potential issues and have confidence in its Integrity data cataloges facilitate data governance by establishing policies controls and guidelines for data use security and privacy data catalogs Advance collaboration by providing the centralized platform where users can work together on data assets and share insights okay you've been working on a project to compile individual player data you have had an easy time searching for a single player because the metadata allowed you to search an entire data catalog now let's move along to the many benefits of data cataloges first the comprehensive metadata provided in data cataloges can enhance data understanding leading to more accurate analyses decision-making and business strategy second users can quickly locate and access important data assets this helps data teams be much more productive and by streamlining both metadata management and data Discovery data cataloges can decrease time spent on data preparation data cataloges also enforce data governance practices and Safeguard data Integrity privacy and security this ensures organizations meet compliance requirements finally data cataloges create a wonderful culture of innovation because they Empower people organization wide to become more data literate and therefore more confident sharing their ideas I'm confident that you are discovering some great new ideas to share with your future data team as well data cataloges are just the beginning so keep learning about how you can contribute to cloud data no matter where your compass may lead you every time you search the web your search results are built around something called metadata the simplest browser search can return vast amounts of information describing each of the web pages in your search results including the page titles brief descriptions keywords and the sources or authors this is metadata metadata is just data about data and in the world of metadata just as with a web search the possibilities are Limitless so get ready to discover the true potential of your data metadata describes organizes and contextualizes data making it easier to understand and use metadata Works behind the scenes playing a critical role in ensuring data is searchable and meaningful by a data analyst metadata encompasses various attributes that describe data it includes details about data structure format origin quality and meaning think of metadata as the what when where and how providing crucial information about the data's characteristics and properties there are a couple of different types of metadata that data professionals are most likely to encounter in their work first is technical metadata this focuses on the detailed aspects of data like file formats structure source and lineage which is where the data has moved throughout a system and how it has transformed over time technical metadata is the foundation for SE less data accessibility flow exchange and integration ensuring compatibility and interoperability across systems and applications the second type is business metadata which focuses on data's context and meaning business metadata includes the meaning of the data Associated business rules and information about data ownership and relationships it provides the necessary context to understand the significance and relevance of data in context of business objectives business metadata provides a business important context and enables datadriven decision-making it helps bridge the gap between technical complexities and business requirements these two types of metadata are complimentary together forming a comprehensive approach to managing and using data effectively but it's still very important to be able to distinguish between them so keep in mind that technical metadata focuses on the details while business metadata provides the business context and meaning thank you for joining me in this exploration of metadata data about data can feel a bit complex so being able to use metadata to describe and understand information is going to be a valuable skill for your future cloud data career hi there thanks for joining me in this video all about data Lakehouse architecture here you'll review the history of data lakes and data lake houses and take a deeper dive into how data lake houses can increase a data team's agility when creating reports dashboards and queries now you'll first check out a quick history lesson in the early days of data analytics the term data warehouse emerged to describe the architecture used to store and organize data this analogy likened the W house to a large organized storage space companies need to store thousands of terabytes of data including tricky unstructured data like product reviews social media posts images and near realtime data streams as a cloud data professional your organization may already have their data Lakehouse in place but it will help you to know about the selection and building of data lak house architecture so that you're aware of how your database works and how your data moves an architecture is a framework that defines the design of a technical solution this includes various components and technologies that are arranged to let organizations pool share and scale resources over a virtual Network for your purpose a data warehouse architecture defines the data structure from the data ingestion to the data presentation data ingestion is the process of obtaining importing and processing data for later use or storage before we explore data Lakehouse architecture let's start with the data warehouse the architecture for a data warehouse relies on the idea that all data is routed to a single area the data warehouse the basic architecture of a data warehouse includes the data sources the extract transform and load or ETL process ingestion into the data warehouse and moving to visualization business intelligence and Reporting programs now that you have a basic understanding of data warehouse architectures consider what might happen in an organization with continuous streams of data as technology advances and the internet becomes more common the speed volume and variety of data increases exponentially as the amount of data increases traditional data warehouse limitations become apparent to the data team to address these challenges data teams developed data Lakes a direct contrast to the highly organized data warehouse data Lakes are unstructured fluid and vast a data lake is a database system that stores large amounts of raw data in its original format until it's needed data Lakes are composed of costeffective storage systems that accumulate vast amounts of data rather than carefully planned table structures with rows columns and limited data types data Lakes typically use a file system with folders that are named for each set of data data Lakes make data ingestion easier and facilitate quicker access to data but quality and consistency become more difficult to ensure within the unstructured data Lake environment enter data Lakehouse architecture an approach that combines the best features of data warehouses and data Lakes a data lake house stores data in its native format maintaining the accessibility benefits of a data lake and a data lake house incorporates structured elements and organization similar to a data warehouse this ensures data quality and consistency you'll notice that some of the components and Technologies in a data Lakehouse architecture are also found in a data warehouse architecture the data Lake architecture starts with all data and moves into the ETL process from here the data moves into the data Lake then it is transformed before moving into a data warehouse a visualization program or into a machine learning model next here are some of the data lake house architecture advantages first it provides scalability enabling businesses to store and process vast amounts of data without requiring additional Hardware or software to transform it second it offers flexibility allowing companies to leverage various data tools and Technologies without compatibility concerns and it saves money on storage and processing costs that sounds great right but what happens if you have a need for a structured data warehouse you can have a two- tier architecture that includes both a data warehouse and a Lakehouse data lakehouses Empower organizations to store process and analyze data in a much more efficient way this is only possible because data lake houses are built on an effective data architecture and by understanding that architecture you've now added another building block to your own well-designed data career architecture is the Art and Science of designing buildings and other physical structures it encompasses everything from conceptualizing initial design to overseeing construction this video is all about architecture not of buildings but of data and in particular data lakehouses let's begin with the significance of data Lakehouse architecture in modern data management data Lakehouse architecture is a comprehensive approach to managing an analyzing data data Lakehouse architecture combines a data lake with a data warehouse the data lake is a repository of data in its original form and the data warehouse is organized sets of structured data The Lakehouse allows you to combine both of these structured and unstructured data sets into a single platform since the lake house combines two data structures the architecture is crucial to developing Pipelines an architecture is a framework that defines the design of a technical solution the architecture of a data lake house combines two separate platforms it also allows you to connect all of your tools to a single data source there are five layers of a data Lakehouse architecture to keep and organize all the data these include ingestion storage metadata application programming interface or API and consumption think of these as the building blocks for any data Lakehouse architecture let's review an example of what goes into each of these layers first is the data sources layer this includes structured semi-structured and unstructured data then there is the ingestion layer which can bring all of these data types into the data Lake housee either through batch or streaming processes next up is the storage layer in this layer some data goes into the data Lake and other data goes through ETL and into the data warehouse from here our data goes through a metadata layer where governance rules are applied and indexing occurs from here apis are used to abstract and simplify data and metadata access for the final layer this is the consumption layer where business intelligence visualizations and machine learning occurs as a data Cloud professional once you add the data to the data source versus layer let's follow what happens in each of the other five layers in a little more detail next the primary purpose of an ingestion layer is to pull data from the data sources layer and deliver it to the storage layer in some cases this is just using batch and streaming strategies to move data into the data Lake for structure data you may Implement an ETL structure and move data into a warehouse by leveraging scalable storage you can efficiently store structured semi-structured and unstructured data in the data lake house this versatility allows you to seamlessly integrate diverse data sources and ensure that no valuable information is Left Behind the metadata layer plays a major role in ensuring data Integrity privacy and compliance this includes data governance metadata management data quality and security one of the key strengths of the data lake house is the metadata layer it cataloges all of your data both structured and unstructured and data in your data Lake and your data warehouse next up is the API layer this layer is designed to help you integrate apis that process tasks faster this is also the stage where you might integrate machine learning finally there is the consumption layer this layer provides you tools and interfaces to extract valuable insights from the business's data business intelligence tools including visualization dashboards and querying interfaces give you self-service analytics capabilities so you can easily explore the data create reports and gain near realtime insights data Lakehouse architecture offers a transformative approach to managing and maximizing data it combines scalable storage powerful compute capabilities effective control and userfriendly business intelligence layers and your data Lake know how will help you Empower any future employer to make the most of each of these valuable features congratulations you've reached the end of another section of this program through these topics you explore data organization data governance and data lak houses and the various aspects of data organization that can affect decision-making processes first you discovered the basics of normalized and denormalized data then you were introduced to data governance Technical and business metadata and master data management next you explored the components and types of data cataloges last you learned about the benefits of data Lakehouse architecture and how a data Lakehouse can transform an organization's data management awesome job on your progress so far can't wait to catch up and see you again in the next section hello and welcome to the next section of this course I'm excited to guide you through these topics all about exploring and finding data one of the coolest things you're going to do is query large amounts of data in big query this is going to be incredibly valuable for your future career in cloud data analytics in addition you'll discover proven methods for tracing data to its source and you'll learn how to access and explore data libraries first you'll get right into an example of how to find data using big query this is essential after all you can't analyze data if you can't find it next you'll learn what it means to trace a data source and how to use data lineage a feature that helps a cloud data professional follow their data's Journey Through the systems where the data came from where it went and what changes were made along the way then you'll get an introduction to analytics Hub and all the tasks you can perform finally you'll explore data Discovery curation and unification as well as why they're important in the cloud setting once you finish this section you'll have the know how to effectively use these tools to find data and I'll find you in the next video what gets me excited about my role is being able to design some of the largest Data Systems in the world hey I'm Ryan I'm a cloud data engineer here at Google Cloud what I love about working in this field is peeling back the covers on technology and data systems and being being able to understand what is actually driving decisions and driving the services that I use on a daily basis as an enduser as a kid I was always curious about how things worked and within my role as a cloud data engineer I look at data and try to derive insights out of it and with that uh curiosity that I developed as a kid I'm able to apply that to my daily role where I'm always looking for how to connect different data sets together to help derive better business value for customers when I was a young software engineer I was always met with resistance with trying to push the boundaries within the organization that I was in I was always interested in trying to find new ways of doing things new technologies to apply to common problems and throughout my career I sort of found my path in innovating um uh along the way to actually satisfy that itch for curiosity and Innovation at the time I was making a career transition into a cloud-based role and in order to prepare for that role I did a lot of reading tutorials a lot of watching YouTube videos and then I also built my website on the cloud itself to help me stand out from the rest of the applicants for the role that I was applying for and that really helped me understand a little bit more about cloud services and helped me ramp up along the way I feel like I have a large impact within my role because the customers that I work with are able to provide new features new insights and new data to their customers I face a significant challenge working with a customer in the health industry because the health industry has very high stakes because the decisions that you make directly impact people's lives we had to make sure that our design was very very comprehensive and that we had exhausted all different points of failure such that we were able to ensure that when we went live with the system that we were very very confident that we weren't going to um encounter any issues the margin of error was very very small if we didn't deliver a notification to somebody who needed a notification at that time they wouldn't be able to take the appropriate action such as getting their child to the hospital or getting their child to a doctor that experience helped me grow in my role because it taught me what it takes to deliver on a solution and to never give up ultimately at the end of the day you're not going to always have the answer from the beginning and to be able to navigate through complexities and be able to learn along the way really taught me about perseverance the advice that I'd give to someone starting with in this career is to stay curious there's always so much to learn and so just having that natural growth mindset or that Curiosity really helps you develop uh and become a better data engineer humans are usually intrigued by finding out something's origin or Source sometimes we investigate things to better appreciate their meaning and significance like a cultural tradition or a work of art other times we check things because we care about certain issues like confirming our food was grown sustainably or that the products we buy were manufactured ethically knowing where things come from is also important in the data world this is because understanding a data source is lineage that clearly shows where the data has moved throughout its life cycle and how it has transformed over time ensures its integrities and lets data professionals share insights with confidence so what exactly is a data source a data source is a place where data was generated data sources can take various forms including databases application programming interfaces file or even streaming platforms databases usually hold structured sets of data and store and manage large volumes of data application programming interfaces or apis are used to gather data from external systems like social media feeds files can come in many types like Excel CSV or Json files these types enable the Import and Export of data between systems streaming platforms provide a steady flow of live current data that can be collected and processed for near realtime analysis for example analyzing near realtime user interactions on a website this wide variety of data sources can create challenges related to compatibility integration and understanding the data each one requires a unique approach so it's important to understand what they are used for in order to use them most effectively all right so tracking lineage for data sources involved following data from its point of origin to its current state in order to better understand where it's been and how it may have been affected along the journey determining lineage for a data source can also lead to better understanding of the context surrounding the data provide traceability and help audit its reliability and accuracy and it helps data professionals ask better questions and make informed decisions maybe most importantly data lineage provides a clearer understanding of its authenticity quality and integrity and it helps organizations maintain control over their data assets this is why data tracing is so important to data governance compliance and regulatory requirements just like reading the label on your food or researching a company before buying its products data lineage and traceability provides critical transparency accountability and Trust And as data really does shape our world it's essential for you as a cloud data professional to analyze and verify the data in your data career working with trusted data will help your business achieve better outcomes just one of the many reasons why data professionals are so incredible the world's oldest continually operating library is thought to be in Fez Morocco opened in 859 its Maze of rooms holds thousands of rare books and manuscripts containing information about people philosophy medicine astronomy physics mathematics law and much more today people visit this library from all around the world to Glimpse these fascinating texts databases are kind of like modern libraries instead of being filled with books they're filled with data and just as people visit a library to find books about anything in everything databases enable users to locate diverse data sets one such resource is Google analytics Hub a data exchange and library of internal and external Assets in this video you'll learn all about analytics Hub its architecture user tasks and more let's get going first just like you can use a library's catalog to search and check out books and other media analytics Hub organizes and secures data then helps users find the data they need for an analytics project acting as a connector between producers and users analytics Hub provides a process of sharing and using data among organizations while ensuring safety and privacy analytics Hub is built on a publish And subscribe model of big queries data sets this means data producers or Publishers make their data sets available to data consumers or subscribers the separation of compute and storage enables data producers to share data with many users without having to duplicate it data producers only pay for the space to store data and consumers only pay when they access or run queries on the shared data so a data publisher first identifies the data set they want to share in big query then creates a listing of the data sets in analytics Hub after the listings have been published they manage the use of their shared data sets after a subscriber browses analytics have defined a data set they can subscribe to it then a readon link to the data set is made available in the subscriber big query project now they're ready to query the data there are three key data data management features shared data set data exchange and listing and the subscriber workflow has a fourth feature called the linked data set let's check these out shared data sets are collections of data tables and Views that data Publishers share in big query data subscribers receive a version called a linked data set this is similar to any other big query data set but it's readon in this way the data set always Remains the Same and the subscribers doesn't have to pay to store it also each piece of data is uniquely identified as a listing these listings include a link to the data set a brief description and related documentation data exchanges can either be open to every user or restricted to certain users with exchange administrators managing who can access the data by default the exchanges are set to private now let's discuss what users can accomplish with analytics Hub there are four main types of users publisher subscriber viewer and administrator first an analytics Hub publisher can generate income with instant data sharing within their organization or with network Partners it can also use listings to share data without creating duplicates also an analytics Hub publisher can build a catalog of data sources ready for analysis and create detailed permissions that ensure the data reaches the right users and it can manage subscriptions to the listings next there's the analytics Hub subscriber who can merge shared data with existing data and when a user subscribes to a listing a linked data set is created in their big query project and they can use built-in Tools in big query to analyze the data then there's the analytics Hub viewer who can browse through data sets and ask for permission to use the shared data and finally there's an analytics Hub administrator who can create data exchanges that enable data sharing and give access permission to both data Publishers and subscribers now there are a few analytics Hub limitations for Publishers to be aware of when using analytics Hub we'll discuss just a few now first if a publisher creates a listing for a shared data set that's encrypted for more control over key operations with a customer managed encryption key subscribers won't have the cloud key to access the data set second there is a limit of 1 th000 linked data sets to a shared data set and third when creating a listing a data set with unsupported resources can't be shared for example not all routines are supported in shared data sets and there you have it analytics Hub connects those who create data sets with those who need data sets and just like a library with thousands of interesting titles analytics Hub offers tons of well-managed and easily accessible data sets as a cloud data professional you'll benefit from the process of being able to share and use data among organizations in today's data filled World many industry professionals like to think of information as the currency of business success but a big challenge is separating the data gems from the Pebbles to find the insights that will Empower effective analytics in this video you'll learn how to make your own data Sparkle with key tools and techniques for managing and maximizing data in the cloud but first some fundamentals to lay the groundwork we'll need some data Discovery this is the process of finding and understanding data assets within a data set or data ecosystem and identifying relevant patterns and relationships for data Discovery to work well you need the right tools and you need to understand what a business wants to achieve but if you know what questions to ask and what insights to look for you can help a business make the most out of their data the next step is data curation this is the process of selecting and organizing data to ensure it's useful and of high quality curating the data creates a solid foundation for analysis and decision-making data curation is a critical part of the data analytics process because it also involves data preservation and access which preserves data for future use and makes data available for those who need it then data unification is the process of integrating data from diverse sources to create a Consolidated view usually data exists in different formats and locations making it challenging to analyze comprehensively data unification brings together disparate data sources harmonizes their structures and enables holistic analysis data unification ensures that data analysts are working with a complete and single view of all data which leads to more accurate insights and better decision-making all right now let's explore the benefits of data Discovery curation and unification in the cloud the cloud off offers unique advantages that can revolutionize your data management and Analysis processes one significant Advantage is scalability resources can easily expand or contract Based on data Discovery curation and unification needs when working with a small data set or a massive data ecosystem the cloud provides the flexibility to adapt to user requirements access is also a key benefit of cloud-based data management Cloud Solutions allow seamless access to data Discovery Cur and unification tools from anywhere at any time this supports collaboration and remote work while breaking down geographical barriers when it comes to data Discovery curation and unification cloud-based Technologies also bring powerful automation capabilities consider the process of data curation in traditional data management curating large data sets can be timec consuming and resource intensive but with cloud-based automation tools these tasks are streamlined by automatically identifying and resolving quality issues performing data transformation and applying predefined rules and policies this accelerates data management and Analysis workflows the cloud also provides security measures and compliance Frameworks to protect data during Discovery curation and unification cloud service providers prioritize data security and offer Advanced encryption access controls and regular compliance audits this ensures the confidentiality integrity and availability of your data and of course all of these benefits combined to equal some serious cost savings with all of your organization's cost savings you'll have even more resources to dedicate towards finding more of those sparkly data gems have you ever read an ad that claimed a certain percentage of dentists recommend a particular chewing gum or that the majority of people in a taste test like the flavor of One pasta brand more than another the numbers can be compelling and might even make consumers want to purchase the products but statistics should always be regarded with caution in particular it's essential to consider the context in which they exist without context data can be both meaningless and misleading maybe the dentists who participated in the survey weren't given the option to choose no chewing gum at all or maybe they were presented with just a few Brands to choose from rather than all the gum on the market likewise the people taking the taste test can easily be led to a particular direction by The Pasta Company for example example just displaying one dish in a more appetizing way than the others can influence a Taster's decision context is the condition in which something exists or happens it's all about the surrounding circumstances affecting the data like the specific questions asked in the dentist survey and the way the pastas were presented in the same way identifying the context surrounding a data set is crucial for Meaningful and truthful analysis datax is a centralized data catalog that unifies search and data discovery which helps data professionals understand the source of data data plx simplifies the process of data source identification as users can easily navigate through complex data environments to find just what they're looking for and confirm that it's reliable datax provides a centralized Hub where users can explore catalog and manage data assets they gain a comprehensive view of the data ecosystem enabling informed decisions and valuable insights dataplex provides a userfriendly interface for exploring data sources within big query big query allows users to store and analyze massive data sets it offers fast query performance and scalability making it ideal for handling large volumes of data to use dataplex to identify data sources in big query first log in the dataplex platform dataplex scans many data sources automatically within Google Cloud so you can start exploring right away so you want to find a data set click on the data set Tab and browse through the data sets that appear if you already have a data set in mind start typing its name or even just the first letters in the search bar then click search a list of data sets will appear and you can easily select the one you want you can also filter data assets based on different criteria if you head over to the filter section there are some cool options if you want big query data sets then select big query and data sets instantly a list of big query data sets will appear but if you're interested in tables you can filter further by choosing big query and tables and you'll get a list of just big query tables this is a quick and easy way to find exactly what you want once you've selected a data source you can examine its metadata to better understand its structure how the data is organized stored and connected its schema a blueprint of how the data is organized within the data source its lineage a history of the data's journey and other important details keep exploring the capabilities of data Plex to make sure you know how to identify and select meaningful and trustworthy data sources whether your data analysis project is about chewing gum pasta or anything else knowing the context of each and every data set you use will be an essential part of your future career check out the progress you've made you're almost done with this section of the course in the previous section you explored how to find data in big query next you explored what a dat data source is and how data lineage and traceability is useful then you investigated analytics Hub its architecture and common tasks that you can perform as an analytics Hub user finally you shifted to data Discovery curation and unification you also got a close-up view of data Plex and the importance of identifying data context congratulations on an important milestone in your Voyage to data analysis in the cloud hello there data virtuoso I'm so glad to be with you again today we're going to learn about accessing data using Cloud tools you'll discover how to interact with data tables and use optimization techniques to improve your queries you'll also use cloud-based data lakes and data warehouses to link up with helpful data sources and answer important business questions okay now let's check out exactly what's coming up first you'll explore data patterns and how to create table schemas in big query then you'll get an intro on tools for Google Cloud integration like vertex Ai and Google colab you'll even Explore some fascinating machine learning Concepts then you'll work with partitions tables which are large tables divided into smaller segments and gain some great strategies to help you better understand the many benefits of partitioning after that you'll discover how to manage partitions tables with information about data subsets and query partition tables finally you'll end with an exploration of data proc for scripts managing data proc clusters and more this section is full of information that will prepare you for the next exciting steps of your data career so let's get started hello and welcome to this video about table schemas in big query schemas are one of the most important tools for data professionals they help describe how data is organized which provides a lot of valuable Clarity context and structure and structuring data is an important part of ensuring that it's usable here's an example maybe a data team at a commercial real estate agency is tasked with compiling surveys from clients who have recently leased a commercial property the inputs on the surveys include scaled responses clients rank the effectiveness of real estate agents from 1 to five or least effective to most effective the survey also includes questions that have a true or false response option and the clients are invited to add comments in open response questions when an analyst begins to compile the data they decide that they want to import all of the data about every agent into a single table to complete this import they will need to create some sort of organization and structure for the data they need a schema to create this table a schema is a way of describing how something like data is organized a database schema is a way of describing how an entire database is organized including all of its tables and their relationships a table schema is a way of describing how each individual table within a database is organized such as its columns and data types there are three primary ways that database schemas are created first as a data analyst you can create the schema as you load the data into a table from the Google Cloud console then you assign the schema in the console to design the schema in the console provide each column's name and data type for each field use the add field option and specify the field name type and mode you also need to know what columns the data has before you begin or if creating a new table without any data it's important to have a plan for the columns the data will have as it's collected the second option you have to create a schema is to use schema autod detection this is a feature in big query that infers the schema based on CSV Json or Google Sheets data just import the existing data and big query will figure out the schema to set up schema autod detection in big query select autodetect schema when creating a table then big query determines the data type for each column big query determines the data type for each column by selecting a random file in the data source then it scans up to 500 rows of data to create a representative sample once complete big query assigns a data type to each field based on those values Pro tip it's always a good idea to check the Google Cloud console or the command line to confirm the accuracy of the data types assigned to each field all right now the third option you have to specify a data schema is to use a j on schema file this file includes the column name column mode column data type and column description and can be used when creating a table from the command line but cannot be used from the console to create a new table from Json file with schema autod detection in the big query Explorer pane click create table in the data set info section in the source section select Google Cloud Storage under the create table from section there you can select your Json file be sure to select Json elel under file format if you'd like to autodetect the schema you'll select autodetect and that should do it you should have your Json data uploaded in big query in no time so returning to the client surveys it's now time to ingest them the data team decides to use schema autod detection they upload all of the data and big query creates column names for each of the data sets but after reviewing the results the data team supervisor suggests having a bit more control over the column names no problem one of the analysts just recreates the schema with Google Cloud counil perfect now the schema is working great the commercial real estate agency is able to easily understand agent performance and provide any helpful feedback or training to make the client exper experience even better and now you know several ways to create a database schema making your data analysis experience better as well you're on your way to structuring data in a meaningful way and you have more experience working in the Google Cloud console and big query great work hello let's start this section by thinking about language one common aspect of many languages around the world is dialects which are variations in language that may present in grammar vocabulary or pronunciation the data field also has dialects especially when it comes to programming languages programming language dialects are typically very small differences that don't change the intrinsic nature of the code one of the most popular programming languages is SQL usually referred to as SQL SQL works with many different databases with some minor variations so learning the basics will give you a great foundation for programming with SQL and setting up database tables and that's what you're going to learn in this video okay to start a SQL dialect is a version of SQL that's unique to a specific database it's important to recognize that all SQL languages have the same basic structure as standard SQL for the most part the key commands are identical or very similar but there may be a few differences in the syntax across the various dialects or small differences in the code syntax is a predetermined structure of a language that includes all required words symbols and punctuation and their proper placement commands are an important part of SQL syntax and as a data analyst as you learn to construct SQL syntax there are four basic commands that you need to know when working with data retrieving information selecting columns sorting and creating a table or database retrieving information involves pulling information from a table statements used to retrieve information include select from and where select identifies the needed information this is done by selecting either individual columns or all columns from identifies which table to use and where adds conditions on the data being returned for example requesting only data that contains a certain value or only data with a particular keyword now we select columns this requires both select and from statements select identifies the column and from identifies the table that the column should come from great now we've come to sorting to sort data use the same first two statements select and from to identify the column of data to be retrieved then the order by statement specifies which column to sort by order by will automatically sort an ascending order if the dec command is added order by will then sort in descending order finally let's check out how to create a table using SQL to do this type create table then list all of the column names and describe the type of data to be found in each column the data type typ of a column defines the kind of data that can be stored in it this is important to ensure that data is stored efficiently and that you can query data correctly common data types include numeric string and Boolean to name a few the exact data types available may vary depending on the SQL dialect that you use let's try this out imagine you want to create a table in the customer's data set called customer names this table will have two columns customer ID and customer name the customer ID column will store a unique identifier for each customer this column will be of type int64 which is a numeric data type that can store large numbers this makes it a good choice for storing identifiers which are typically large sequential numbers the customer name column will store the customer's name this colum will be of type string which means that it can store text Data this is a good choice for storing names addresses and even phone numbers when you run this query an empty table called customer names will be created in the customer's data set this table will have two columns customer ID and customer name and each column will store its own type of data nice you now know the foundation of SQL dialects these simple commands will set you up for successful interactions with whatever database you encounter as a new data analyst working on a variety of databases helps you better understand SQL dialects and makes it possible for you to contribute useful code right away data holds the key to transforming Industries and shaping the marketplaces of the future add to that the exciting power of machine learning or ML and you can open a whole new world of insights and groundbreaking advancements but there's a catch traditional methods of data analysis like statistics limit the potential of ML and this this video you'll learn some simple steps for using cloud computing to take ml to the next level but to start consider the definition of machine learning machine learning is the use and development of algorithms and statistical models to teach computer systems to analyze and discover patterns and data ml algorithms and models rely on vast amounts of highquality data to make accurate predictions and drive smart decision-making accessing the right data at the right time is crucial for the success of ml projects and that's where the cloud becomes a GameChanger to consider how this works let's consider a real world example with a data analyst named Zayn Zayn's organization wants to predict annual farming yields in an agricultural Community but his organization has only been tracking crop yields from public data sets that include communities all over the country he doesn't have any information about crop yields in your community Zayn knows that he'll create a machine learning model to help with the prediction but he's missing some data this is where the cloud comes to the rescue Zayn can request data sets from various organizations and he can use these data sets to train his ml models in this case he'll ingest data from internal data sets from local farmers and from the National Weather organization Zayn will take data about both forecasts and actual reports and he'll use that to start to train the model Pro tip data sets from private organizations sometimes require coordination to access after you've received permission to access you'll need to find a way to transfer the data as you start to work with machine learning models you may find that the data sets you access provide the reference points you need to train your models now let's get back to Zayn it's time to get the necessary data sets first he chooses the appropriate cloud service provider based on his organization's particular needs and requirements then he sets up the necessary credentials and permissions to ensure secure access to your data finally Zayn establishes connections to the data resources before you ingest data from external data sets you first need credentials credentials are similar to a login that you'd use on a personal account these are a username and a password an organization may give you credentials that allow you to access and transfer data once you have credentials you will need to use an interface that allows for the transfer of the data from an external organization to your own there are a few interfaces you may come across in your work login credentials application programming interfaces or apis and software development kits or sdks each of these interfaces allows you to ingest data directly from an external data set to your own data set an API is a protocol that enables one application to interact with another application in your case you'd use an API to access and transfer data an SDK is a set of software building tools that include groups of code libraries as a data analyst you might use an analytics SDK to access data about users and their interactions with your software for zay's work with the crop prediction model he is able to access an API this allows him to transfer data directly from the national agriculture database and into his own database ingesting data directly can streamline your process and create a direct Pathway to your machine learning model this means your model can get to work at this point you can select a common model or create your own and the best part is once you set the initial parameters your model will be able to train itself okay now let's check out some common types of models you can create with machine learning first is a class classification model you may train a classification model to classify items or group items into a predefined category based on common characteristics this could be as simple as determining whether something is a mammal or a reptile or as complex as determining whether a new product is likely or unlikely to sell next is a clustering model which involves grouping data points that are similar to each other in some way in this instance machine learning will decide how to group items together based on similarities determined by the model for example you may try to determine what geographic area has customers that are the most likely to purchase products another type of model is a linear regression model linear regression is a technique that estimates the linear relationship between a continuous dependent variable and one or more independent variables with linear regression you may try to predict sales or even the amount of rain that might fall next week finally there are ranking models a ranking model uses characteristics to order items by likelihood for example entertainment streaming services use ranking models to recommend music or movies that customers are likely to enjoy these models try to find similarities in what users listen to or watch and rank new entertainment options by the likelihood that users will enjoy the content so back to zay's crop prediction after reviewing the data he uses a regression model to try to predict the amount of crops his town can expect to produce in the upcoming year so now he has data sets and he knows what type of machine learning model he will use Zayn is well on his way to building a model that can predict which years will have the most Crop Production the cloud is your gateway to data access and to maximize the incredible capabilities of ml by working with the cloud you'll ensure ml can continuously improve its own models keep exploring the world of datadriven discovery y machine learning or ml is really incredible it has so many capabilities for example it can identify objects and photos and analyze medical images it can understand and process natural language for chatbots voice assistant and translations and it can recommend products services and content to help users find just the right online store movie or new playlist in your data career you you may have the opportunity to train and deploy ml models to prepare you for this really cool opportunity this video will explore vertex AI an ml platform and how it combines with big query for data collection but first the definition of machine learning ml is the use and development of algorithms and statistical models to teach computer systems to analyze and discover patterns in data ml helps data professionals make better decisions automate processes and uncover valuable insights vertex AI takes ml to the next level by providing a comprehensive platform for developing deploying and managing ml models at scale it allows you to use machine learning operations to manage and govern all of your ml workloads this means that your data enters and moves through your pipeline quickly so you can focus on innovating for example consider an online store and worldwide Marketplace that sources products from other sites and personalizes search returns based on users past activity you're a new data analyst at this online store and your team is responsible for increasing the accuracy of projected ship times for each product in the past your organization has built machine learning models and ingested data monthly to update projected ship times but this process is slow and usually the monthly updates provide customers with inaccurate projections one of the first projects that your team tackled is moving the on premises data warehouses into Google cloud from there your team develops a pipeline to ingest new data in near real time and that is scalable when there are influxes or reductions in data once your data is prepared and made available for ML your team's next step is to automate hyperparameter tuning hyperparameters are parameters whose value is used to control the learning process this is the part where the power of machine learning begins and the model starts to update itself your team will set the hyperparameter metrics you want to optimize before the machine learning process begins this will help the model to train itself even more exciting with vertex AI your team can accelerate the hyperparameter tuning as vertex AI will auto adjust your hyperparameters to help you determine the best values to set next your team will focus on updating the delivery time predictions your team can rely on vertex AI to automate your machine learning models and update predictions given the hyper parameters your teams model will constantly update itself using the data that pours into your organization site on a daily basis there are a couple of options for moving your organization's on promises databases into the cloud one option for cloud data storage is Big query big query provides powerful querying and data access capabilities you might have already learned about how you can use bigquery to access your data but bigquery also has buil buil-in machine learning capabilities that you can use to build ml models directly within the platform in an on promises database or a physical server that houses your database you would need to have advanced programming knowledge and access to specialized Frameworks to develop your ml model with big query you can use your SQL knowledge to develop machine learning models let's go back to the Online Marketplace you and your team solved the problem of calculating shipping times now you can use big query SQL to solve another problem your team needs you to generate a daily report of projected sales for the next day you know that you'll need constant data input and a model that projects sales every 24 hours based on multiple inputs including products pass sales by date pass sales by hour and pass sales on holidays you use big queries built-in linear regression model to forecast sales on a daily basis linear regression is a technique that estimates the linear relationship between a continuous dependent variable and one or more independent variables you can input your information including products past sales by date past sales by hour and past sales on holidays then using SQL you can create a model and use the pre-built linear regression model big query will get to work now you have access to daily reports about projected sales and the best part is as more data is input your model will train itself and become even more accurate machine learning is a super valuable technology that can be used to answer all kinds of questions and solve a wide variety of problems and with automated options you can build and upkeep your own models easily welcome back you may have noticed that a lot of work with data is done with a team sometimes the tools we have may not be dynamic enough for teams to work collaboratively the good news is that Google collab can help with that in this video you'll learn about collab you'll also discover how Jupiter notebooks and python make the capabilities of collab even more amazing let's get started collab or collaboratory is a cloud-hosted version of Jupiter notebooks that allows users to write and execute python in a browser with no configuration required data analysts working in collab have access to Graphics processing units for free and their work is easily sharable the two main contributors to collab are Jupiter notebook and python Jupiter notebook is an open source web-based platform for creating and sharing documents that consist of code equations narrative text and visualizations it can be used for many tasks like numerical simulation machine learning and data visualization Jupiter notebook or Jupiter is most frequently used within a python environment with Jupiter data professionals can write in multiple programming languages including python Java R Julia matlb octave scheme processing Scala and many others Jupiter is also used for data visualizations bash scripts markdowns and mathematical and scientific notations python is an objectoriented programming language it's flexible and easily adaptable to changes which makes it a popular tool for data analysts python is the primary programming language used in collab and users write python code through most popular web browsers including Google Chrome Milla Firefox and Safari then users can run their code on a browser without a command line interface or runtime environment collab notebooks allow users to combine executable code and Rich Text in one document along with images HTML latch and more after creating a collab notebook it's stored in the user's Google Drive the notebooks can be easily shared with collaborators who can then add edits or comments in the data field data analysts use Python libraries for data analysis and visualization with collab python libraries are collections of code that can be used to automate some functions they can import data into collab notebook books from spreadsheets and many other sources machine learning programmers also use collab for their data work they can import an image data set train an image classifier with that image and assess the model with just a few lines of code and because collab notebooks run code on Google's Cloud servers data Professionals of all kinds can tap into Google's Hardware including graphical processing units and tensor processing units without worrying about the limitation of their personal computers all they need is an internet browser now that you're familiar with the uses of collab consider the benefits of collab notebooks for data analysis first Cab's free version uses graphical processing units and tensor processing units for up to 12 hours at no cost this means that users can access Cab's powerful Computing resources to do things like analyze large data sets also users can create sharable links for collab files stored on their Google Drive for easier collaboration and notebook sharing and users can install libraries like AWS S3 gcp SQL MySQL and others that are not available in code samples libraries are useful for accessing and analyzing data they allow users to tap into a variety of databases cloud storage services and other resources another benefit is that collab has a bunch of pre installed libraries like numpy and caras this means that users can immediately start to code without needing to set up these libraries plus since collab saves everything in Google Drive storage users can pick up where they left off from any computer using their Google Drive account if you're a GitHub user you can even connect your GitHub account to collab and move your code files between them easily also collab is compatible with all sorts of data sources which is great for machine learning and AI training projects and just in case you're worried about losing any changes collab keeps track of every single change you make from the moment you create a file pretty cool right okay a few uses to ensure collab remains free for users its resources are not guaranteed and not unlimited and the usage limits may vary this means that while collab provides valuable computational resources at no no cost there can be fluctuations in their availability also when sharing a collab notebook all its content including text code output and comments will be shared but users can emit code sell output from being saved or shared enabling users to run the cells and see the results themselves to emit code cell output from being saved or shared in a collab notebook users can go to edit select notebook settings or preferences check the box for omit code cell output when saving this notebook and close the settings dialogue Google collab combines the power of a text editor with a python coding environment all within an internet browser it's like having a high-powered coding laboratory right inside a regular Sketchbook keep practicing to discover all the new possibilities hi there future data Pro thanks so much for joining me in this video about database partitioning you're going to to learn how to make your data work much more efficient by dividing data into manageable and efficient segments let's get started database partitioning is the process of dividing data into separate data segments or partitions that can be managed and accessed separately database partitioning occurs across servers or databases it's important to call out that database partitioning is different from table partitioning which involves segmenting data within a single table without Distributing data across Hardware database partitioning offers many benefits but the most important are improved scalability availability and performance let's discuss each of these benefits first database partitioning helps with improved scalability by spreading data across multiple partitions by dividing the data into manageable Parts the system can handle more work efficiently ensuring continued excellent performance second partitioning helps with improved data availability by dividing the data across multiple servers this also prevents a single point of failure and data partitioning includes a built-in backup feature that ensures that Services remain available if a failure occurs third database partitioning helps with improved performance by allowing the system to query a smaller part of the database instead of the entire thing this makes the service more efficient when partitioning databases there are three three key strategies that data professionals employ horizontal partitioning also known as sharding vertical partitioning and functional partitioning horizontal partitioning is a process for dividing data into separate segments in which each partition or Shard is its own data storage but all shards follow the same organizational layout each Shard keeps A Unique Piece of the whole data like all orders from a certain group of customers consider a sneaker inventory that is divided into shards based on the SKU or ID number this sneaker inventory is an example of horizontal partitioning next vertical partitioning is a process for dividing data into separate segments in which each partition maintains A Unique Piece of the fields for items in the data store these fields are divided based on how often they are used so fields that are used often might be put into one vertical partition and Fields that aren't access as frequently might be placed than another in the sneaker inventory example one partition holds frequently accessed inventory data including sneaker name color and price another partition contains other inventory data like current inventory and location lastly functional partitioning is a process for dividing data into separate segments in which data is grouped based on how it's used in different parts of the database system with functioning partitioning data is grouped based on how it's used in different parts of the database system for example sneaker Brands may be placed in one partition based on what the sneaker was designed for like training or running simultaneously they could be assigned to another partition based on pricing there are three key considerations when incorporating partitioning into an already active system first it may be necessary to change how data is accessed in the system second dividing data into different partitions will require the migration of large amounts of existing data and third users will want to keep using the system during the data migration now dive into important considerations when partitioning data first up parallel processing parallel processing enhances query performance by dividing the data into smaller parts that can be processed at the same time parallelism is the system's ability to perform multiple tasks simultaneously on different database partitions next consider application requirements application requirements refer to how the data will be used queried and changed in order to design a system that performs well responds quickly and remains reliable application requirements are important because database partitioning can make system design and development more complex and a pro tip users must rebalance partitions to address uneven distribution of traffic when there is a surge this is done by creating a new strategy and moving data from the old partitioning scheme to a new one nice work you now understand how database partitioning improves query performance by allowing a system to work with smaller subsets of data the result is faster and more efficient analysis by applying an effective partitioning strategy in your own data work you'll provide your organization with a big Advantage as it navigates through its Data Systems have you ever searched through a pile of papers trying to find a specific document it can be very timec consuming but what if papers were neatly organized in a folder with labeled sections for personal banking medical and so on your search would become so much easier and faster well that's basically what partition tables do in a database system they neatly categorize data into separate sections or partitions streamlining both data management and queries in this video you'll learn what it means to partition a table one to partition a table and the types of table partitioning you can perform you'll also learn about clustering and concert with partitioning and as another option okay so a partition table is a large table that is divided into smaller segments or partitions partitioning reduces the amount of data a query needs to process this has two benefits it improves query performance and it controls costs in a partitioned table data is stored in SE separate storage units each containing a single data partition unlike database partitioning which results in managing multiple databases a partitioned table can still be treated as a single table partitioned tables also keep track of the metadata about the data stored in each partition and can use that metadata to optimize queries also thanks to the metadata big query can provide a more precise estimation of a query's cost before it's run partitioning is effective for columns with fewer unique values so that each partition still has a relatively sufficient amount of data in big query it's best to have at least one gigabyte per partition for example if you have a table storing months or years worth of data you could store each day's data in a different partition this way if you are only interested in querying the last 30 days worth of data big query knows it does not need to scan any partitions older than 30 days now consider are some examples of when to partition a table first partitioning is valuable when a data professional needs to improve query performance by only scanning a specific section of a table second if a table operation exceeds the expected volume of data the data professional needs to limit it to specific partition column values this is a benefit of higher partition table quotas third another time of partition is when the data professional needs to set an expiration schedule to automatically delete entire partitions after a specific time period fourth a data professional should consider partitioning when they need to load data to a specific partition without affecting other partitions in the table Fifth and finally a data professional should partition when they need to delete specific partitions without scanning an entire table there are three ways to partition a table integer range time unit column and ingestion time partitioning with integer range partitioning users partition a table based on ranges of values in a specific integer column to create an integer range partitioned table provide the partitioning column the starting value for range partitioning the ending value for range partitioning and an interval of each range in the partition next up time unit column partitioning this type of partitioning enables data professionals to partition a table based on a date timestamp or datetime column when writing data into a table big query will automatically place it into the appropriate partition based on the values in the column when working with timestamp and datetime columns data professionals can set partitions with hourly daily monthly or yearly divisions for date columns they can set partitions with daily monthly or yearly divisions the partition boundaries are based on coordinated universal time or UTC time finally with ingestion time partitioning big query automatically assigns table rows to partitions based on the time when the data is ingested or imported by big query data professionals also have the flexibility to choose between different partition divisions based on their specific needs ingestion time partition boundaries are also based on UTC time great now let's move on to Cluster tables a clustered table is a table in which column order is defined by the user using clustered columns and a clustered column is a userdefined table property that arranges storage blocks based on the values within their columns the order of the values in a clustered column determines the order in which the rows of the table are stored in memory and disk this can improve the performance of queries that access the table by the clustered column because the rows are already sorted in the order that the query needs them for example think of a table with sales data with columns like product date and regions by defining the date column as the clustered column the storage blocks within the table will be sorted by date order so rows with the same date will be grouped together the size of the storage blocks in a clustered column is flexible and adapts to the size of the table clustering is great for columns with tons of unique values so that even more rows can be filtered out by querying a clustered table keeps the Sorting criteria in the context of each operation modifying it just like partition tables clustered tables improve query performances and if clustering on a table that is also partitioned each partition's data will be sorted based on the clustering columns there are many very useful options available for all sorts of data projects and no matter which you choose you'll be able to locate what you need quickly and easily just as a well organized folder helps you locate specific documents partitioning and clustering in big query facilitates effective data management and faster query performance pruning is the practice of removing unwanted branches from a tree gardeners prune trees to improve their overall health to shape the trees and to help the trees produce more fruit in the data field we do a kind of pruning as well and just like with trees pruning makes our data work more fruitful in this video you'll explore partition pruning partition prun in is the process of eliminating unnecessary or irrelevant data from consideration when running a query in other words the data professional runs a query using a qualifying filter on the value of the partitioning column this tells big query to scan the partitions that match the filter and skip the rest all right now let's examine the queries that can be run on different types of partitioned tables first to remove unnecessary partitions when querying a table partitioned by a Time unit column use a filter based on the partitioning column consider this example of a query partitioned table a data set table is partitioned based on the transaction date column the example query prunes dates by excluding any before January 1st 2016 now the ingestion time partition tables in big query there's a special column called Partition time this column holds the coordinator universal time or UTC when each row was imported rounded to the near nearest partition boundary like hourly or daily this is represented as a timestamp value if a data professional were to add data on April 15th 2021 at 8815 UTC with a partition granularity of hourly the partition time column for those rows will store the time stamp value truncated to the hour and if the table is partitioned by each day it will also include a fake or pseudo column called Partition date this is just the partition time shortened to present only the date and is represented by a date rather than a time stamp value to prune partitions on ingestion time partitioned tables filter either of these columns this example query only scans the partitions between the dates January 1st 2016 and January 2nd 2016 all right so to prune partitions when querying an Inger range partitions table include a filter based on the integer range partitioning column consider the example of an integer range partitioned table it has partitioning based on a range of numbers with a focus on customer ID between zero and 100 in steps of 10 the example query scans the three partitions that start with 30 40 and 50 data that is being sent to Big query in near real time is written to write optimized storage before being moved to its assigned partition the data is temporarily stored in a partition called unpartitioned and you can query data in this temporary unpartitioned partition data in the right optimized storage has null values in the partition time and partition date columns okay now to query data in the unpartitioned partition use the partition time pseudo column with the null value great now let's consider three best practices for Designing and implementing partition printing strategies the first best practice is to use a constant filter expression to limit the partitions that are scanned in a query this is helpful because you will always reduce the amount of data processed to only the partitions needed and that will make your query more efficient the second best practice is to isolate the partition column in the filter filters that require data from multiple fields to compute will not prune partitions and the third best practice is to require a partition filter in queries to ensure queries always eliminate unnecessary partitions part partition pruning improves queries on partitioned Tables by eliminating unnecessary data and enabling analysts to focus on only relevant partitions this makes data work more efficient effective and insightful just like a flourishing beautifully pruned tree which comes back even more bountiful year after year hi there and thanks for joining me in this video all about data proc data proc is a fully managed service for running Big Data data processing jobs on the Google Cloud platform you may know a little about data proc already but in this video you'll consider how to use data proc in your work as a data analyst to understand data Pro's many benefits let's check out an example maybe a data professional is working at a governmental agency where data flows like the soundwaves of a NeverEnding Symphony day after day for six whole months a data analyst diligently Combs through and processes the numbers like a true data conductor it soon becomes clear to the analyst that they're performing the same tasks and delivering the same reports time and time again eventually the repetition starts to seem like an endless loop they're playing the same tune on repeat and sometimes hitting a few wrong notes along the way it occurs to them that it must be possible to either automate portions of the work or find a way to reduce errors so the data analyst decides to use data proc to run Hadoop and spark clusters data proc is a fully managed service that maximizes open-source data tools for batch processing querying streaming and machine learning with data proc users can create clusters quickly manage them easily and save money by turning off clusters when they're not needed using Hadoop and Spark clusters the data analyst can significantly reduce the manual effort required process data efficiently and mitigate potential errors before we move into the specifics of data proc let's review its key processes batch processing is a method of collecting large volumes of data over a long period of time and then processing it all at once querying is requesting data or information from a database streaming involves working with data as it is generated and finally machine learning is the use and development of algorithms and statistical models to teach computer systems to analyze and discover patterns in data data analysts can process data in big query directly from data proc and can manage data proc with the Google Cloud console Apache Hadoop is a framework that distributes the processing of data across clusters of computers when working with data proc data analysts may also encounter pypar the python API for Apache spark pypar is a language for creating more automated analyses and pipelines these can be applied to both structured and semi-structured data and there are several benefits of integrating data proc into a workflow once a data analyst integrates data proc they're able to process data at a lower cost because clusters are turned off when not in use also the process speeds up because the work is distributed across multiple machines and clusters with the integration of Hadoop the integration with big query means that a data analyst only interacts with a single platform for all of their analysis needs and data proc is fully managed by the Google Cloud platform so no maintenance is required on analysis systems plus with integrating data proc into the workflow data analysts can ingest data several times per day without fail likewise the Clusters scale up and down so the organization only pays for the compute power needed with very little oversight of the data integration and a consistent application of the batch processing the data professional is now able to devote more of their time to analyzing the data and finding valuable business insights and that's music to their ears congrats you've completed another section of the program awesome work you now know how to interact with big query tables and use optimization techniques to improve queries plus you experienced using a cloud-based data Lake and warehouse to connect with data sources and answer business questions with data you explored data patterns and learned how to create table schemas in big query then you worked on integrating Google Cloud tools into big query you also discovered the benefits of partitioning and how to manage partitioned tables finally you use data proc for data processing and dove into managing data proc clusters great job you're one big step closer to your goal hi I'm Vince hi I'm George congratulations on making it through this course now you'll have an opportunity to look in on an interview while it's happening this interview will include technical topics from the course we hope that this helps as you prepare for your next interview so what interests you in a career in cloud data analytics what got me interested about a career in cloud data analytics was in college everyone was talking about the cloud and how powerful that it can be and how much it seemed like it was the future of where technology was heading and it sounded like something I'd be interested in I started to look more into the cloud and how I can use it in my studies in business and I saw how scalable and how powerful it could be and decided that it was an area that I wanted my career to go into so can you tell me about a favorite data analytics project that you worked on and tell me what your role was and what you liked about the project my favorite dat data analytics project was one where I was a data analyst where I got to combine all of these data sets about compressors and engines where I was able to put them up in the cloud and perform some statistical analysis to help prescribe if they're going to have some sort of Maintenance event or fail and I I really liked it because it had a real world impact suppose you're working for a company uh that wants to modernize their data Lake and their data warehouse what are some components of a modern cloud data platform they should consider they should consider their ETL policy their data life cycle policy um their privacy policies and then how they're going to scale all their data and make it available and and if they can apply any machine learning or AI onto it so when it comes to ETL can you talk to me about the differences between batch processing and stream processing the differences between batch processing and stream processing is for batch processing you will process all of your data at once in one large workload but for stream processing you're going to process each little bit of data that comes through your system can you tell me some use cases for for each a good use case for batch processing would be data analytics if you want to perform data analytics around how a product might be performing you want to have a complete picture of the performance and so for batch processing you would wait until you have a complete uh data set a good use case for streaming data would be like stock trading you want to know where the market is moving at any given minute and you can't wait until the end of the day and so you would need to process that data in real time can you give me an example of a problem that a streaming data source would solve a problem that a streaming data source would solve might be something like a intrusion detection where a security company could monitor real time data in order to determine if there's any unauthorized Personnel in some perimeter it could also be a virtual perimeter like in the cloud all right so imagine that you've been asked to build a new report for a toy Manufacturing Company the report should contain the names of each toy built and the number of units shipped by each month what data would you look for and where would you look for this data in Cloud tools if I wanted to create a report that showed each toy and how much we shipped each month the first pieces of data that I'd be looking for is their manufactured date and the names of each of these toys and any variations of these toys because we'd probably want to track that as well and I would find all this information in big query so what language would you use to query the data in big query I would use structured query language and that's how we talk to databases to retrieve any information that we need from them if you're looking to essentially query the number of units shipped uh by month you don't have to sort of say the query exactly as you might type it into uh console but what might that query uh look like in general that query would look like selecting all of the the products and any variations of them that we might be interested in reporting on and I would sum like a unique count of each product who had a manufactur date within a certain month and I would aggregate those to get a view that shows for each toy that we produce how many we ship that month really appreciate you taking the time to interview with us uh and I really wish you luck with the rest of the process thanks Vince I really appreciate your time today and it's been a pleasure great to meet you in this scenario George demonstrated how to provide examples when answering questions during an interview you can differentiate Yourself by providing examples of how you've used your skills in relevant situations watch for more interview tips later on in this program awesome work you've made it to the end of this course I hope you've enjoyed learning with me all about cloud storage and data management in the cloud my favorite part about analytics is that it combines the objectivity of data with the creativity of Storytelling at Google many of my projects end with a colorful dashboard or snazzy slide deck explaining why Trends are happening and how folks should respond at their core the stories that I craft are grounded in truth truth without proper data management they'd be impossible to tell as you continue building your analytic skill set I'm excited to imagine all of the stories underneath the numbers you've gathered you started by learning about data storage and connections types and structures then you moved on to table schemas and batch and streaming data processing then you explored denormalized data data governance metadata data cataloges the key components of data Lakehouse architecture and more then you discover data Plex and how it can be used to identify data sources in big query you learn to identify and Trace data lineage and access data libraries finally you explore data reference architectures how to manage tables in big query add and export data and query tables and integrate data proc then you explored the benefits of partitioning and managing data proc clusters you now have a solid foundation in organizing and structuring data which will be important for your role in cloud data analytics congratulations on finishing this course I'm excited for your next [Music] steps
Original Description
Enhance your skills with hands-on labs! Get started with the Beginner: Google Cloud Data Analytics Certificate: https://goo.gle/3xL0mUJ
[Course 2 of 5, Google Cloud Data Analytics Certificate] Hi again! Get cozy with key components of data governance, normalized and star schemas, data catalogs, as we unveil the data lakehouse architecture.
To earn this Google Cloud Certificate with a digital credential you can share, hop on over to our platform to complete the hands-on labs (available on desktop/laptop only) and graded assessments. There is a monthly subscription cost of $29 USD/month to earn the certificate. https://goo.gle/49Lcqn4
Jump directly to the topics you want to learn:
00:00 Introduction to Course 2
03:10 Eric: Data analytics skills translate across industries and roles
02:20 Welcome to module 1
05:21 Data storage and connections
10:10 Gerrit: Experience with a variety of tools can help you as an analyst
13:22 Common ways to store data
16:13 Structured, unstructured, and semi-structured data
20:52 Example of a data lakehouse
25:13 Aspects of table schema
29:31 Introduction to nested data structure
34:00 Overview of data processing methods
38:27 Module 1 Wrap-up
39:18 Welcome to module 2
40:09 Denormalized data
42:19 Data governance for effective data management
42:19 MK: Risk management in a cloud-first world
49:58 Introduction to master data management
54:09 Introduction to data catalogs
58:54 Technical and business metadata
1:01:49 Overview of data lakehouse architecture
1:06:57 Components of data lakehouse architecture
1:11:34 Module 2 Wrap-up
1:12:21 Welcome to module 3
1:13:36 Ryan: Curiosity can help you understand and connect data
1:16:58 Data lineage and traceability
1:20:13 Introduction to Analytics Hub
1:25:30 Data discovery, curation, and unification
1:29:10 Benefits of using Dataplex
1:32:44 Module 3 Wrap-up
1:33:23 Welcome to module 4
1:34:42 Methods for defining BigQuery table schemas
1:39:43 Basic SQL commands for querying data
1:44
Watch on YouTube ↗
(saves to browser)
Sign in to unlock AI tutor explanation · ⚡30
Playlist
Uploads from Google Cloud · Google Cloud · 0 of 60
← Previous
Next →
1
 2
2
 3
3
 4
4
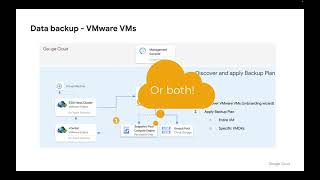 5
5
 6
6
 7
7
 8
8
 9
9
 10
10
 11
11
 12
12
 13
13
 14
14
 15
15
 16
16
 17
17
 18
18
 19
19
 20
20
 21
21
 22
22
 23
23
 24
24
 25
25
 26
26
 27
27
 28
28
 29
29
 30
30
 31
31
 32
32
 33
33
 34
34
 35
35
 36
36
 37
37
 38
38
 39
39
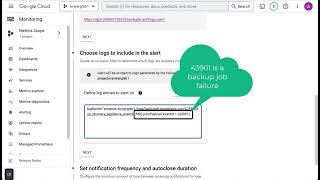 40
40
 41
41
 42
42
 43
43
 44
44
 45
45
 46
46
 47
47
 48
48
 49
49
 50
50
 51
51
 52
52
 53
53
 54
54
 55
55
 56
56
 57
57
 58
58
 59
59
 60
60

Top 3 ways organizations are adjusting their cloud strategies to prepare for economic uncertainty
Google Cloud
Google Cloud Retail Search and Browse Console deep dive
Google Cloud
Google Cloud Backup and DR - How to mount, clone or restore a VMware VM
Google Cloud
Google Cloud Backup and DR - VMware vSphere Backup Overview
Google Cloud
Google Cloud Backup and DR - Creating backup Plans for VMware VM backups
Google Cloud
Google Cloud Backup and DR - Compute Engine Instance Backups and Sole Tenant Nodes
Google Cloud
Google Cloud Backup and DR - Managing Service Accounts
Google Cloud
Let’s solve for what’s next
Google Cloud
Google Cloud Executive Briefing Center | Cloud Space | Silicon Valley
Google Cloud
Tinyclues with Google Cloud offers CRM Intelligence to maximize conversions
Google Cloud
Aible partners with Google Cloud helping customers build predictive models within minutes
Google Cloud
TELUS streamlines big data ingestion with help from Google Cloud and Accenture
Google Cloud
Getting started with Apigee API Management
Google Cloud
Google Cloud Retail Search
Google Cloud
Building your first API proxy with Apigee
Google Cloud
Brands and agencies develop dynamic video ads with Connected-Stories NEXT and Google Cloud
Google Cloud
Redefining the transportation industry
Google Cloud
Google Cloud Project Katalyst
Google Cloud
Israel's Family Court: Creating more compelling experiences for its citizens
Google Cloud
Tausight partners with Google Cloud to help healthcare industry protect PHI activity & take action
Google Cloud
Google Cloud Retail Browse
Google Cloud
Verifying API keys and debugging your API proxy flow
Google Cloud
Getting started with Apigee API Management
Google Cloud
Adding policies to your APIs
Google Cloud
Google Cloud Backup and DR - Configuring Google Cloud VMware Engine to work with Backup and DR
Google Cloud
Topaz Subsea Cable
Google Cloud
Episode 29: Building a culture of data literacy with Latin America’s biggest ecommerce platform
Google Cloud
Weshalb Datananalysten die Sparringspartner von Produktmanagern sein sollten
Google Cloud
Warum und wie METRO eine Machine Learning-Pipeline implementiert hat
Google Cloud
Wie nutzt METRO Data Science, um geschäftliche Herausforderungen zu meistern?
Google Cloud
Google Cloud in Qatar. Let's get solving.
Google Cloud
Google Cloud for Qatar
Google Cloud
Doha has a new Google Cloud region
Google Cloud
The new Google Cloud region in Qatar
Google Cloud
Build, tune, and deploy foundation models with Vertex AI
Google Cloud
Generative AI on Google Cloud
Google Cloud
Who will be coming to Google Cloud Day Tel Aviv? #Shorts
Google Cloud
Protect your organization at the edge
Google Cloud
Google Cloud Backup and DR Alert Notifications setup
Google Cloud
Build, tune, and deploy foundation models with Generative AI Support in Vertex AI
Google Cloud
Where the Internet Lives: Data center on the prairie
Google Cloud
Which developer program are you joining?
Google Cloud
Lufthansa Group baut intelligente Systeme zur Vereinfachung des Flugbetriebs
Google Cloud
How ASML revived Moore's Law and remade chipmaking
Google Cloud
CMO of Unity celebrates Women's History Month
Google Cloud
Vint Cerf on Google Cloud Digital Leader
Google Cloud
Mobile World Congress 2023
Google Cloud
Topaz - Canada
Google Cloud
Google Data Cloud & AI Summit 2023: Reveal opportunities to transform your business
Google Cloud
Building a conversational bot with Google Cloud Gen App Builder
Google Cloud
Elisa Polystar and Google Cloud partner to bring the power of analytics and automation to CSPs
Google Cloud
Network modernization - how can CSPs start now?
Google Cloud
How Semios uses imported and remote models for inference with BigQuery ML
Google Cloud
Deliver your AI solutions up to 100 times faster with Google Cloud partner, Snorkel AI
Google Cloud
Capture consumer perspectives for CPG using NLP and analytics with Harmonya and Google Cloud
Google Cloud
Delivering Cloud-Native Network Transformation
Google Cloud
Proactively detect & investigate anomalies & data quality issues in BigQuery with Telmai
Google Cloud
Introducing AlloyDB Omni
Google Cloud
Episode 30: How Auto Trader transitioned to the cloud to analyze tricky customer data
Google Cloud
MongoDB Atlas on Google Cloud
Google Cloud
More on: Data Literacy
View skill →









Related Reads
📰
📰
📰
📰
I Built My Second ETL Pipeline. This Time, I Started Thinking Like a Data Engineer
Towards Data Science
JuiceFS Sync for PB-Scale Data Transfers: Resumable Sync, Encryption, and Bandwidth Control
Dev.to AI
How Airflow is using AI to make data engineering more resilient, not more complex
Medium · AI
What Can We Do When Memory Becomes the New Bottleneck in Data Engineering?
Towards Data Science
Chapters (32)
Introduction to Course 2
3:10
Eric: Data analytics skills translate across industries and roles
2:20
Welcome to module 1
5:21
Data storage and connections
10:10
Gerrit: Experience with a variety of tools can help you as an analyst
13:22
Common ways to store data
16:13
Structured, unstructured, and semi-structured data
20:52
Example of a data lakehouse
25:13
Aspects of table schema
29:31
Introduction to nested data structure
34:00
Overview of data processing methods
38:27
Module 1 Wrap-up
39:18
Welcome to module 2
40:09
Denormalized data
42:19
Data governance for effective data management
42:19
MK: Risk management in a cloud-first world
49:58
Introduction to master data management
54:09
Introduction to data catalogs
58:54
Technical and business metadata
1:01:49
Overview of data lakehouse architecture
1:06:57
Components of data lakehouse architecture
1:11:34
Module 2 Wrap-up
1:12:21
Welcome to module 3
1:13:36
Ryan: Curiosity can help you understand and connect data
1:16:58
Data lineage and traceability
1:20:13
Introduction to Analytics Hub
1:25:30
Data discovery, curation, and unification
1:29:10
Benefits of using Dataplex
1:32:44
Module 3 Wrap-up
1:33:23
Welcome to module 4
1:34:42
Methods for defining BigQuery table schemas
1:39:43
Basic SQL commands for querying data
🎓
Tutor Explanation

 DeepCamp AI