K Means Clustering Intuition
Key Takeaways
Explains the K-Means Clustering algorithm with geometric intuition
Full Transcript
hello all today we'll be discussing about the maths behind k-means clustering i'm just going to write it down maths behind k-means clustering that basically means that we'll be understanding the conclusion behind caimans so in my previous videos in one of my videos i have already explained you how to implement k-means clustering which is an unsupervised technique by using escuela and there we also discussed about something called as elbow method find out the right value of K so today we will understand what is the maths behind us suppose now let me consider that I have a problem statement you know and as I said that k-means clustering is an unsupervised machine learning technic unsupervised okay that basically means that we don't have any output so suppose I have some data you know something like this and drop it in another color somewhere like this okay I am I've just defined this into two colors because I know that this this these two points this to group of points are basically in form of clusters right so initially it will be in one color but after we apply k-means clustering what the output that we will be getting is basically who group of two group of outputs so these two groups are nothing but two clusters that is what k-means actually help us to do know it finds a similarity between the points and it is then able to group them into clusters so I can call this as my cluster one and this is my cluster two and that is the thing that came instead of me doing but to do this we are going to discuss first of all what is the algorithm that is basically used there are five steps of algorithm that we are going to use and to actually define my k-means clustering model the second thing is that the what metrics will be using there are two metrics that we use in this one is Euclidean distance and one is Manhattan distance we will be discussing that then the third topic that we'll be discussing is something called as what is elbow method who's this elbow method will be used for selecting the right selecting the KA value so let us go ahead and start the discussion now suppose I have a point okay so I have some points like this okay so what does this particular K means clustering steps in this game is cluster so first steps is that we have to select the key value this K value are nothing but centroids and explain you what is centroids just give me a second suppose I consider my K values to and I'll also show you how we can select this K value how I am selecting it has to whenever i have this kind of distribution okay by just finding the similarity between the data how can i group them and what should be my K value how many centroids should at me or should I be have if I have to centroid that basically means two questions and I'll show you how to select the K value in my second step that we will be doing is basically we need to initialize these two centroids random suppose if I initialize this to Santro it's randomly in this plane then my data will look something like this so let me just draw the point once again you so these are my points right and as I said that I'm going to initialize my two centroids randomly so I have leashless once it right and once in freedom so initialize the centroid initialize the centroid randomly in the plane okay initializing means that I am just initializing some point so the next step is basically I need to find out the distance which are my points that are nearer to this particular centroid and which are my point that I'm here at through this particular interval so for this what I will do is that I'll make this as blue color okay so in order to find the distance here we are going to use a Euclidean distance which is called as you know if we use a Euclidean distance find the distance which are the points that I'm here at to the low points and which are the point that are nearer to the pink box in order to draw it you can just use a simple technique okay I'll just draw our two lines over here on straight line I'll draw like this and the other straight line that I draw is like this now when I draw this whatever points I am coming on top of this particular straight line that will become I think let me just draw this particular thing once again so this will become my thing color that basically means that this is basically nearer to my pink points right and similarly this blue point this whatever points are present below this particular line it becomes my blue points so here you have all the blue points now by this we have categorized two group of data but still the step is not done right then what we'll do is that we select the group we select the group's right we select a group and find the mean value and find the mean value right so when I when I take this when I take this this pink color group you know I'll find the sum of all these particular elements I'll find the sum of all these particular elements similarly for this blue statements also what I will do is I'll find the sum of so when I say some basically and find the average of all these elements okay average very important after I find the average of distinct points I have to move this centroid to that position similarly I have to move the centroid for this particular position based on the mean value that I get so what I'll do is that after this and again draw a straight line now how my data will look like so my new centroid suppose this is my paper like and suppose my news position is this one okay after I moved it from here to here similarly my blue position will be somewhere here okay and then I'll have a having all my blue points laughter this what I will happen is that again I'll create a straight line and perpendicular line make this you know to find out whether any points has been moved or not I'll repeat this whole step that is from the second one which lies the centroid now I have now what you know have updated my centroid and move the position so I have to again you know find out which all points are nearer to the point I get to test when I do that you can see that some of the pain points have moved towards blue so this will become my blue point and this Blue Point will somewhere become like a peel if suppose it becomes a pink one right then again what will happen again I am having two groups again the mean will be calculated my centroid will be updated to this particular position similarly this particular group will be calculated again my disposition will be moved over here the blue point will be moved over here now this stuff happen again I'll go and try to find out the settlements and finally you'll be thinking that this stuff will be happening unless and until we get a fixed number of groups okay and no point movement will get changed so that is my final step as soon as I'll be able to do that that basically means that it is giving me two clusters and these two clusters are nothing but two groups right and they I'm taking the K values - okay but I have not told you how I am selecting the K value as to why I am selecting the K value s so I'm going to begin with this see this just draw all the diagrams one by one okay so initially this is my position okay so initially my points were in black color suppose okay now I wanted to implement that k-means clustering okay in such a way that I need to group this two data and as I told that my next step was basically to initialize centroids initially this is one centroid and this is one centroid suppose that what I did is that I created a straight line I divided this point this all became tinkle right because these were the points near active the pink color and now this water points that bacon nearer to the green so now I have to centroids now what will happen is that I'll compute the mean of all these points and I'll update my point based on that particular mean this is my central so I'll update that in my next graph what will happen is that draw the next point and draw all the pink point as it is if but my Centrepointe has now been updated to this particular point based on the mean of this value similarly with respect to my green when green will also get updated somewhere over here right because I will find the mean suppose my given green has come away and I am myself I know all the points are there now this dot will be processed unless and until we get exact number of clusters based on the K value that I have such that no movement of points are happening between pink and green and once it is done we can say that our model is ready our model is ready and it is able to do the classification now as discuss that how I am computing the distance I will be calling that as an equilibrium distance the Euclidean distance basically says that if I have a point II won e to you represented by x1 comma y1 e to is represented by X 2 comma y 2 then you claimed in distance that is a distance between this two point is basically given ba root of x2 minus x1 divided by Y 2 minus y 1 whole square plus all right so this is basically my form okay so this is how you clean in distance it's done now the next thing is that how should I select my K value or selecting the K value we basically have something called as elbow matter you the elbow method basically says that I will be running on loop from K is equal to 1 to 20 suppose okay in k is equal to 1 to 20 that basically mean my self ride is 1 suppose now this is my point and I'm just drawing all the points like this so for K is equal to 1 I will be running the whole process of k-means so that basically means that my point will get initialized somewhere here for K is equal to 1 then what I do is that I find out the distance that is w WC ESS it is nothing but we didn't cluster sum of square okay and this is basically given by summation of I is equal to 1 to n the distance between the you know centroid plus all the points so I can write C of I plus X or Phi whole square so I'll calculate the distance between all these points and for the initial event the key is one our WCS is value will be very very high so when I just go and plot my diagram with respect to K value and with respect to W CSS value initially when my K value is 1 my WCS is value will be also high then with K is equal to 2 now when I have K is equal to 2 I will be having two centroids and I'll be computing the distance for the point that belongs nearer to this particular value so this will be my distance one right all the distance to this point and all the distance to this point so I will calculate the sum okay I will calculate the sum and after calculating the sum I will be getting all the values right so now for K is equal to 2 what will happen is that this WCS is value will obviously decrease because now I have two centroids similarly when I increase my K value my point will be getting decreased but at at a certain point it will become normal normalized it will become to be working in a very slow manner so how do I select this k value from this elbo meter and this is basically called as elbow method gasps this elbow method is why it is called because it is in the shape of elbow our elbow again I have shown you this in the practical part guys what I am going to do is that once you complete this theoretical explanation you just have to go and follow that particular practical now at this point how which value you have to select we have to select the last value that had an abrupt decrease that had an abrupt decrease abrupt decrease basically with sudden degrees so I from here I can find out that K is equal to three and again this may not be perfectly right because I have just drawn it randomly with my hands right so when I say this this would all you will become my K is equal to three now in my came in so what I will do is that I'll select my K value as three and I'll start implementing once I am done with this I'll be able to group my data into three different categories because I selected my K value is three and this is the optimal one used something called a sentiment so I hope you write this particular video guys make sure that after seeing this particular video I have already provided a link in the description for the k-means clustering algorithm how you have to implement by using Python and SQL ax so make sure that after this particularly do you see that and there is if you have not subscribed my channel please to subscribe it I need to come up with very interesting content and my next video will be basically making you understand about the hierarchical clustering inclusion so I'll see you up in the next video have a great day and thank you you
Original Description
Here is a complete intuition behind K Means Clustering Algorithm. We will understand the complete the complete geometric intuition.
K Means Clustering Practical : https://www.youtube.com/watch?v=tAY6jtFoNEA
You can buy my book where I have provided a detailed explanation of how we can use Machine Learning, Deep Learning in Finance using python
Packt url : https://prod.packtpub.com/in/big-data-and-business-intelligence/hands-python-finance
Amazon url: https://www.amazon.com/Hands-Python-Finance-implementing-strategies-ebook/dp/B07Q5W7GB1/ref=sr_1_1?keywords=Krish+naik&qid=1554285070&s=gateway&sr=8-1-spell
Watch on YouTube ↗
(saves to browser)
Sign in to unlock AI tutor explanation · ⚡30
Playlist
Uploads from Krish Naik · Krish Naik · 29 of 60
1
 2
2
 3
3
 4
4
 5
5
 6
6
 7
7
 8
8
 9
9
 10
10
 11
11
 12
12
 13
13
 14
14
 15
15
 16
16
 17
17
 18
18
 19
19
 20
20
 21
21
 22
22
 23
23
 24
24
 25
25
 26
26
 27
27
 28
28
 ▶
▶
 30
30
 31
31
 32
32
 33
33
 34
34
 35
35
 36
36
 37
37
 38
38
 39
39
 40
40
 41
41
 42
42
 43
43
 44
44
 45
45
 46
46
 47
47
 48
48
 49
49
 50
50
 51
51
 52
52
 53
53
 54
54
 55
55
 56
56
 57
57
 58
58
 59
59
 60
60

Natural Language Processing|Stemming
Krish Naik
Natural Language Processing|BagofWords
Krish Naik
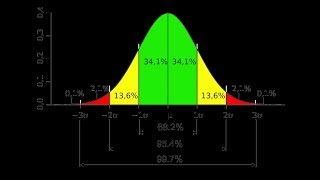
Gaussian distribution or Normal Distribution in statisctics
Krish Naik
Natural Language Processing|TF-IDF for Machine Learning| Text Prerocessing
Krish Naik
Log Normal Distribution in Statistics
Krish Naik
Covariance in Statistics
Krish Naik
Confusion matrix, Precision, Recall| Data Science Interview questions
Krish Naik
Tutorial 44-Balanced vs Imbalanced Dataset and how to handle Imbalanced Dataset
Krish Naik
Implementing a Spam classifier in python| Natural Language Processing
Krish Naik
Tutorial 11-Exploratory Data Analysis(EDA) of Titanic dataset
Krish Naik
Face Recognition using open CV and VGG 16 Transfer Learning
Krish Naik
Pedestrian Detection using OpenCV from Videos
Krish Naik
Face and Eye Detection from Videos using HAAR Cascade Classifier
Krish Naik
Reading, Writing and Displaying images with Opencv| OpenCV Tutorial
Krish Naik
OpenCV Installation | OpenCV tutorial
Krish Naik
Face and Eye Detection from Images using HAAR Cascade Classifier
Krish Naik
Car Detection using HAAR Cascade and Opencv from Videos.
Krish Naik
Using OpenFace for Face recognition in Keras
Krish Naik
OpenPose Tutorial with Tensorflow
Krish Naik
Multiple Linear Regression using python and sklearn
Krish Naik
Dimensional Reduction| Principal Component Analysis
Krish Naik
Movie Recommender System using Python
Krish Naik
TPR,FPR,FNR,TNR, Confusion Matrix
Krish Naik
Precision, Recall and F1-Score
Krish Naik
Artificial Neural Network for Customer's Exit Prediction from Bank
Krish Naik
GridSearchCV- Select the best hyperparameter for any Classification Model
Krish Naik
RandomizedSearchCV- Select the best hyperparameter for any Classification Model
Krish Naik
K Nearest Neighbor classification with Intuition and practical solution
Krish Naik
K Means Clustering Intuition
Krish Naik
Create custom Alexa Skill- Lambda function- Part2
Krish Naik
Hierarchical Clustering intuition
Krish Naik
Implement Transfer Learning with a generic Code Template
Krish Naik
Gender Classifier and Age Estimator using Resnet Convolution Neural Network
Krish Naik
Unlock Your Application With Your Face using OpenCV
Krish Naik
Draw rectangle from webcam and sketch process it on a live feed
Krish Naik
Complete Life Cycle of a Data Science Project
Krish Naik
How we can apply Machine Learning in Finance
Krish Naik
Deep Learning in Medical Science
Krish Naik
How to switch your career to Data Science.
Krish Naik
Linear Regression Mathematical Intuition
Krish Naik
Handle Categorical features using Python
Krish Naik
Machine Learning Algorithm- Which one to choose for your Problem?
Krish Naik
DBSCAN Clustering Easily Explained with Implementation
Krish Naik
Curse of Dimensionality Easily explained| Machine Learning
Krish Naik
Feature Selection Techniques Easily Explained | Machine Learning
Krish Naik
Tutorial 29-R square and Adjusted R square Clearly Explained| Machine Learning
Krish Naik
Cross Validation using sklearn and python | Machine Learning
Krish Naik
Handling Missing Data Easily Explained| Machine Learning
Krish Naik
Deploy Machine Learning Model using Flask
Krish Naik
Deployment of Deep Learning Model using Flask
Krish Naik
How to Visualize Multiple Linear Regression in python
Krish Naik
K Nearest Neighbour Easily Explained with Implementation
Krish Naik
Predicting Heart Disease using Machine Learning
Krish Naik
Predicting Lungs Disease using Deep Learning
Krish Naik
Stock Sentiment Analysis using News Headlines
Krish Naik
Random Forest(Bootstrap Aggregation) Easily Explained
Krish Naik
Voting Classifier(Hard Voting and Soft Voting Classifier)
Krish Naik
Credit Card Fraud Detection using Machine Learning from Kaggle
Krish Naik
Hyperparameter Optimization for Xgboost
Krish Naik
Tutorial 45-Handling imbalanced Dataset using python- Part 1
Krish Naik
🎓
Tutor Explanation
