Time Series Forecasting with XGBoost - Advanced Methods
Skills:
Fine-tuning LLMs53%
This video is a continuation of the previous video on the topic where we cover time series forecasting with xgboost. In this video we cover more advanced methods such as outlier removal, time series cross validation, lag features, and a bonus feature!
Check out part 1 here: https://youtu.be/vV12dGe_Fho
The notebook used in this video here: https://www.kaggle.com/code/robikscube/pt2-time-series-forecasting-with-xgboost/notebook
Timeline:
00:00 Start
01:05 Outline
02:20 Outlier Removal
04:25 Time Series Cross Validation
10:15 Lag Features
13:15 Training Cross Validation
14:52 Predicting the Future
20:09 Bonus!
Follow me on twitch for live coding streams: https://www.twitch.tv/medallionstallion_
My other videos:
Speed Up Your Pandas Code: https://www.youtube.com/watch?v=SAFmrTnEHLg
Speed up Pandas Code: https://www.youtube.com/watch?v=SAFmrTnEHLg
Intro to Pandas video: https://www.youtube.com/watch?v=_Eb0utIRdkw
Exploratory Data Analysis Video: https://www.youtube.com/watch?v=xi0vhXFPegw
Working with Audio data in Python: https://www.youtube.com/watch?v=ZqpSb5p1xQo
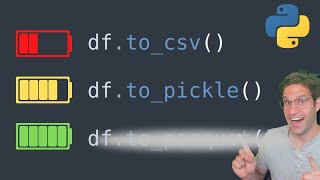
Efficient Pandas Dataframes: https://www.youtube.com/watch?v=u4_c2LDi4b8
* Youtube: https://youtube.com/@robmulla?sub_confirmation=1
* Discord: https://discord.gg/HZszek7DQc
* Twitch: https://www.twitch.tv/medallionstallion_
* Twitter: https://twitter.com/Rob_Mulla
* Kaggle: https://www.kaggle.com/robikscube
#xgboost #python #machinelearning
What You'll Learn
This video teaches time series forecasting with XGBoost using advanced methods such as outlier removal and time series decomposition
Full Transcript
so recently i made a video about time series forecasting with xgboost and this was actually one of my most popular videos so far so thank you all who watched it but because it was so popular i also got a lot of comments and i realized there was a lot of things that actually left out of that video so in this video i'm gonna get into a little bit more detail if you haven't watched the first video i suggest you do check that out i'll put a link somewhere around here and you can click it or just continue watching this i can't tell you what to do all right so let's jump into the code which i will also link as a kaggle notebook below okay so we're in this notebook and let's start talking about some more advanced topics with forecasting with xgboost just a reminder we are using a data set which is hourly energy consumption now i'm not going to go too far in detail with the imports but we are using xgboost which we're going to import as xgb and our error metric we're going to use root mean squared error i'm also importing some libraries for plotting as well as numpy and pandas so a quick outline of some of the things i'm going to cover here that were mentioned in the comments of my last video uh first one i don't think actually was a comment but outlier analysis is actually a pretty important thing to consider with this type of data set and we didn't really get into that last time so we're going to do some outlier removal then we're going to talk a little bit about the forecasting horizon so sometimes when you're building features for time series models you want to build lag features but those lag features are dependent on how far into the future you want to predict then we're going to go into more detail about how to set up proper time series cross validation once you've picked the forecasting horizon you want to use and then we'll create lag features and finally predict the future and i even have a bonus topic that we'll talk about at the very end so let's go ahead and read in this data set remember the columns that we have are really just the megawatts that we're trying to predict and then the index of this data frame is the date time column that we have every hour data for now of course we want to visualize this data so i can take it and run the plot command on it so i've noticed here that in our historic data we do have an area here in 2012 it looks like where the values were really low and this looks like it's nothing to outlier that it's actually not true data there might have been a blackout there might have been some problems with the sensors at that moment and the model is going to learn these sort of outliers unless we remove them so you need to be pretty careful when you're removing outliers and not just removing things that you think are wrong even though they may be legitimate values just legitimate outliers we're actually look at the histogram of this megawatt data and we can see here that most of the time the values are between 20 000 and then peak up a little bit past 50 000 but i want to look at when the values are way lower than this to see if there are any extreme outliers that we'd want to remove so i can just query on this pjm east megawatt value and look for any time the value is less than 20 000. if i go ahead and plot this we can see that the values do get under twenty thousand sometimes but this here is the area where there definitely are some outliers that don't look like they are legitimate so if we actually find a better thresholding maybe less than 19 000 now we can see that it's just these values that really dipped low that we'd want to remove from our training and validation set and all we're going to do is take that query for any values greater than 19 000 and run copy on this so i copy over with this filtered out outlier now you could also do something like looking at the standard deviation and the number of outliers that way but i think visually inspecting a lot of the times is a lot better than uh a heuristic approach especially if you're doing a custom forecasting now on to talking about cross-validation so before in the last video i only did a training and a test split so you can see here the training data is in blue and the uh data that we evaluated on was this test data but a more robust way to do this is actually to use time series cross validation and lucky for us there exists in sk learn something called time series split so you can see here this is the documentation for time series split if you wanted to read in more detail about how it's used but it essentially just allows us to tell it the max training size the number of splits and then it'll create those splits for us and we're going to walk through how we do that so for time series cross validation we're going to import from sk learn model selection time series split and we are actually going to set this object up by setting a time series split with the number of splits being five that sounds reasonable and we're gonna make our test size a set amount so we know that we have hourly energy consumption here and we want to let's say predict out into the future one year so that's going to be 24 hours times 365 days times one for one year and then you can actually provide it a gap so this is the gap between the training and the validation set that you're splitting on each time and we're gonna set that to 24 which will be for 24 hours in between when the training set ends and the test set begins now the thing we need to also remember is we need to sort our data frame on the index if it's not sorted this time series split will not work so the time series split object is actually just a generator so the way you run on this generator is looping over it and applying it to the training data set so if we say train index val index in the time series and then split it on our data frame and then we run a break here you can see that we'll have our train index here which is it'll provide us the index indices in our data frame which will be our training set and val index which will be our validation indices and we'll be able to loop over this five times since we set the number of splits to five now let's go ahead and visualize this because it's gonna be a lot easier to understand if we can actually visualize it and i'm gonna make a matplotlib subplot um we're gonna make one subplot for each of these split so we can see them our fig size is gonna be 15 times 15 and we're also going to do something in here which is share x so that the x-axis is the same then we're going to track our fold so we're going to start at fold number zero and we'll increment each time we could also run enumerate but this i think is a little bit cleaner and then we'll take our training data set is going to equal to when our data frame is the train index and our validation or test is going to be when our our val index and then of course we're going to increment the fold but i also want to plot this add this to our plot so what we'll do here is when we run each time we'll take our training set and plot it and we'll also take our validation set and plot it okay so now if i zoom out a little bit so we can see all these in one we can see how each fold works so it's going back in time and then we have one year of our validation set each fold and because we have a lot of training data going way back into history we can actually do this five different times with no problem where we're actually testing each of the last five years independently from each other now it's important to do it this way we wouldn't want to just take out this first year and then train on data from after it because that would be in some ways a leak about our target into this validation data and when we're doing cross-validation we want to make sure that we're as leak-free as possible doing it this way is really a solid way to do it especially when you have a lot of time series data which is not always the case but when it is you can take advantage of this type of cross-validation let's talk about what exactly the forecasting horizon is so i briefly mentioned it before but this has to do with how far out into the future you want to predict so it is important to have a good idea of what your forecasting horizon wants to be typically further out you get from the day you're predicting it's going to be harder to predict with accuracy so really short in like an hour to two hours in the future is always going to be easier to predict than two to three years into the future and then you're also restricted by things like lag features which we're going to talk about later and you can't add lag features back further than your time horizon so before we get into lag features let's just add the time series features to our data set which we created in last video so these are just features about the time like the hour and the day the week in the year the quarter of the year and those sort of things so the way lag features work is you're essentially telling the model to look back into the past however many days and to use the target value for that many days in the past as a new feature that you feed into the model if we think about our data frame that we have our target value is this pgam east megawatts value what we're going to do is we're going to create a dictionary with this which we'll use then for mapping these lag features onto our data frame so we're going to save that off and call it target map and now let's take the data frame index for every day and let's subtract a time delta this is going to be some days into the past from our index day so we can just put into here 364 days now you might be asking yourself why did you use 364 and not 365. well a little trick is if you use 364 it's actually divisible by seven and it will give you the exact same day of the week so you don't have to worry about mapping out days of the week into the past the index minus 364 says this same date last year on the same day of the week what we will do then is take this for each index in our data frame and we'll map on our target using the map function and our target map dictionary which we created and we're going to store this in our data set as lag one let's call it lag one that's like a one year lag variable now you can make this for um 30 days you can make it for whatever you want but it can't be longer than your forecasting horizon keep that in mind so let's go ahead and do this for 728 and do it for call this lag 2 and lag 3. let's go ahead and actually make this into a function called add lags on our data frame and then we'll return our data frame and we will just for completeness add our lags onto this data frame all right now if we just run ahead on our data frame we see that we have all of our features here as columns now we also have these three lag features which are empty they're empty because we are looking at the furthest day back in history that we have data on and there are no there is no way to compute those lags for that far back in the history so if we look at a tail of this we can see we do have the three lag features and these will be helpful when training our model again you can only forecast out one year now we're restricted with this lag one feature because once we look out into the future more than one year we we don't know what that lag value actually is so now we're going to put it all together we have our new lag features we have our cross validation setup and we are going to actually loop over these different cross validation folds and train our model just like in the last video but what we're going to do is we are going to train on the training and test set from this train test split five different times then we are going to score our model using the roots mean square error and we're gonna save those scores to a list so that we can evaluate our score across all those different folds so let's go ahead and run this training loop so we can see it is training here the first fold all right so it's done training five-fold so unlike last time where we only trained this once and saw the validation reach an optimal point we've done it five different times and the nice part is now we can not only use the score we get from one fold but we actually have run five different experiments and we can see how the scores are for each five and ideally the more we start hyper parameter tuning and the more features we add we want to see the scores get better across all of these folds so there are a few different ways of evaluating this but i'm just going to print here the average value using numpy the mean value of the scores and then i'll print each score individually and this would be the cross-validation score that we would be looking to approve upon so i didn't actually show before as many of you noted in the comments how to predict into the future i only showed how to train and then to predict on the validation or test set and uh in order to predict in the future it's pretty simple we just need to create a skeleton frame of dates that we want to predict for but before we create this future data frame we actually want to train the model again one more time with all of our training data and this is important because after we've done this train validation split for time series we still want to leverage all the data we have for our model that we'll be using to forecast into the future so instead of before where we created the x and the y value from the train and validation separately this time we're going to create the features on all of our data i've also changed the number of estimators that we'll train to to 500 the reason for that is because we can see here when we did cross-validation around the 500th iteration is when the models start to over fit so you could actually take the average value across folds when it starts to overfit this will be good just for training here after 500 iterations there's a chance that it might be overfitting a little bit too much so we'll run this training again one last time it's done training so we have our regressor that we've called reg that we can call and predict in the future but we need to make this future data frame and we can do that uh pretty easily by using panda's date range function if we use pd date range we actually can see in the documents that you can give it a start date and an end date and then you can even give it other things like the frequency which will be important for us to use so if we look at our data frame and our index max value our training data goes up until 2018 so we'll take this state and actually make this the first day of our future data frame that we're going to create and just to be safe we'll just go up until the first day of that month as our last date so this is the end date in our date range now if i run this you can see that we have a list of dates from this start to the end date but we want to predict hourly so we're going to go here and add frequency equals and you can just give it a one h for one hour and now we actually have hourly time stamps between these two different dates now we want to create a data frame off of this and we'll pass the index as this future dates time stamps we can call this future df for future data frame now because we have lag features we're actually going to want to stick this future data frame onto the end of our existing data so we can add on those lag features correctly and before we do that i'm going to call create a new column called is future so we could easily identify which of the values are future and which ones are not we could also look for when the target value is empty but this way works as well so i'm going to say for future data frame is future is true and then for our data frame is future is false and then we'll make a new data frame that's just a concatenation of the two so we're going to take pd concat cat our data frame with future and now if we look at df and future we can see it goes all the way out to this 2019 date and we need to remember to create our features on top of this and also create or add our lag features and that's why it's nice that we created those functions let me put all this up there and now that we've added our lag features we can now extract out just the future data by using our dfn future and querying where it is the future we're going to copy this and make this called future with features so our future with features data frame you could see goes all the way out into 2019 it has these lag features it has the other features that we created it doesn't have the target because we do not know the actual truth of that and let's go ahead and predict the future so at this point it's pretty easy we just take our regressor and we run predict on this future with features and we provide it only the features which we've trained the model on let's add this as a new column called prediction and just to prove it to ourselves that it actually does exist let's go ahead and plot this out make the marker sizes smaller so we can see these are the future predictions that we're predicting going up until 2019 so we could if we had our training day all the way up until whatever today's date is then we could predict out into the future one year i did say there will be a bonus thing that i'll show you all and that's just how you can save and reload your xgboost model very easily this was a question that was asked in the comments so we have our regressor which we've trained on all of our data let's say we didn't want to retrain this every time we want to predict every new day or new hour we can actually save this model very easily using the save model method on this regressor so i'm going to save this as model.json it does say in the documents that you can save it as json or this other context but i'm going to save it as a json file and if i do ls.l so it's less than one megabytes of data in this model it's not that big and then we can prove to ourselves that we can load this back in by using xgboost regressor just like we did before calling this our rag new let's say new just so we know it's different than the other one and then reg new will say load model and we'll load this model.json so we can run this and load in the same model that we had before and just to prove it to ourselves even more let's run the same prediction and plot that we did before except with this new model and you can see the predictions look pretty much like they should look identical to the ones that we did before because we've loaded this exact same model thanks for taking the time to watch this video again all the things i mentioned in this video came from the comments of the last one so make sure you like this subscribe to my channel and leave a comment below so i know to make more videos in the future thanks a lot see you next time
Watch on YouTube ↗
(saves to browser)
Sign in to unlock AI tutor explanation · ⚡30
Playlist
Uploads from Rob Mulla · Rob Mulla · 28 of 60
1
 2
2
 3
3
 4
4
 5
5
 6
6
 7
7
 8
8
 9
9
 10
10
 11
11
 12
12
 13
13
 14
14
 15
15
 16
16
 17
17
 18
18
 19
19
 20
20
 21
21
 22
22
 23
23
 24
24
 25
25
 26
26
 27
27
 ▶
▶
 29
29
 30
30
 31
31
 32
32
 33
33
 34
34
 35
35
 36
36
 37
37
 38
38
 39
39
 40
40
 41
41
 42
42
 43
43
 44
44
 45
45
 46
46
 47
47
 48
48
 49
49
 50
50
 51
51
 52
52
 53
53
 54
54
 55
55
 56
56
 57
57
 58
58
 59
59
 60
60
A Gentle Introduction to Pandas Data Analysis (on Kaggle)
Rob Mulla
Exploratory Data Analysis with Pandas Python
Rob Mulla
7 Python Data Visualization Libraries in 15 minutes
Rob Mulla
Kaggle competition starter notebook walkthrough
Rob Mulla
Kaggle Competitions: A Beginner's Guide to Winning
Rob Mulla
Jupyter Notebook Complete Beginner Guide - From Jupyter to Jupyterlab, Google Colab and Kaggle!
Rob Mulla
Audio Data Processing in Python
Rob Mulla
Complete Data Science Project!
Rob Mulla
Make Your Pandas Code Lightning Fast
Rob Mulla
Image Processing with OpenCV and Python
Rob Mulla
Speed Up Your Pandas Dataframes
Rob Mulla
This INCREDIBLE trick will speed up your data processes.
Rob Mulla
Complete Guide to Cross Validation
Rob Mulla
Easy Python Progress Bars with tqdm
Rob Mulla
Economic Data Analysis Project with Python Pandas - Data scraping, cleaning and exploration!
Rob Mulla
Python Sentiment Analysis Project with NLTK and 🤗 Transformers. Classify Amazon Reviews!!
Rob Mulla
Get Started with Machine Learning and AI in 2023
Rob Mulla
The Trick to Get Unlimited Datasets
Rob Mulla
Video Data Processing with Python and OpenCV
Rob Mulla
Object Detection in 10 minutes with YOLOv5 & Python!
Rob Mulla
Pandas for Data Science #shorts
Rob Mulla
Object Detection in 60 Seconds using Python and YOLOv5 #shorts
Rob Mulla
Machine Learning for Facial Recognition in Python in 60 Seconds #shorts
Rob Mulla
Time Series Forecasting with XGBoost - Use python and machine learning to predict energy consumption
Rob Mulla
Detect Text in Images with Python - pytesseract vs. easyocr vs keras_ocr
Rob Mulla
Solving an Impossible Riddle with Code
Rob Mulla
Do these Pandas Alternatives actually work?
Rob Mulla
Time Series Forecasting with XGBoost - Advanced Methods
Rob Mulla
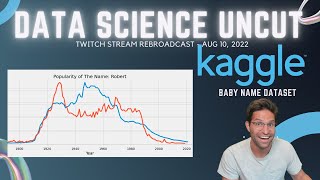
Data Science Uncut - Data Shootout Kaggle Competition (Aug 1 2022 Stream)
Rob Mulla
Kaggle Dataset Creation from Scratch- Data Science Uncut (Aug 10 2022)
Rob Mulla
Chess Board Computer Vision AI - Data Science Uncut (Sep 7, 2022)
Rob Mulla
25 Nooby Pandas Coding Mistakes You Should NEVER make.
Rob Mulla
DEFCON Hacking AI CTF Solution on Kaggle - Data Science Uncut Sep 11, 2022
Rob Mulla
More Chessboard Computer Vision AI - Data Science Uncut - Sep 13
Rob Mulla
Medallion Data Science Live Stream
Rob Mulla
Community Kaggle Competition Overview - Corn Classification (
Rob Mulla
Deep Learning Image Classification - Corn Kernels - Data Science Uncut
Rob Mulla
OpenAI Whisper Demo: Convert Speech to Text in Python
Rob Mulla
Yolov7 Custom Object Detection in Python Tutorial - Chess Piece Detection
Rob Mulla
Live Kaggle Coding - Enzyme Stability Prediction - Data Science Uncut Sep, 27 2022
Rob Mulla
Finding Chess Cheaters with Python! - Data Science Uncut Livestream
Rob Mulla
Data Science Uncut - Kaggle Community Competition & Chess Data Analysis - Oct 4, 2022
Rob Mulla
Flight Delay Dataset Creation (Data Science Uncut)
Rob Mulla
5 Reasons to Kaggle #shorts
Rob Mulla
♟️ Data Science - Chess Data Analysis
Rob Mulla
EXTREME PYTHON & DATA SCIENCE LIVE STREAM
Rob Mulla
What is Clustering in ML?
Rob Mulla
What is K-Nearest Neighbors?
Rob Mulla
LIVE CODING: Flight Data Exploration with Pandas & Python
Rob Mulla
Kaggle Survey vs. Twitter Sentiment
Rob Mulla
If Top Chess.com Players were STOCKS - Live Coding Data Anaylsis Stream
Rob Mulla
Data Visualization BATTLE!
Rob Mulla
LIVE CODING: Stocks & Sentiment Analysis
Rob Mulla
Progress Bar in Python with TQDM
Rob Mulla
Flight Cancellation Data Analysis
Rob Mulla
Synthetic Dataset Creation for Machine Learning - Blender and Python
Rob Mulla
The Ultimate Coding Setup for Data Science
Rob Mulla
Dataset Creation SPEED RUN - Live Coding With Python & Pandas
Rob Mulla
Data Wrangling with Python and Pandas LIVE
Rob Mulla
Forecasting with the FB Prophet Model
Rob Mulla
More on: Fine-tuning LLMs
View skill →


Related AI Lessons
⚡
⚡
⚡
⚡
The Nervous System of the Telco: Unlocking the Real-Time Power of the Network Element Interfaces…
Medium · Data Science
Enhanced RFM Analysis for Customer Segmentation using K-Prototypes
Medium · Machine Learning
One Survey Asked Rich People Ten Times More Often Than Poor People.
Medium · Data Science
Beyond the Credit Score: What 1.3 Million Loans Reveal About Who Actually Repays
Medium · Data Science
Chapters (8)
Start
1:05
Outline
2:20
Outlier Removal
4:25
Time Series Cross Validation
10:15
Lag Features
13:15
Training Cross Validation
14:52
Predicting the Future
20:09
Bonus!
🎓
Tutor Explanation
