Do these Pandas Alternatives actually work?
Key Takeaways
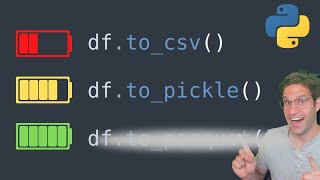
The video benchmarks the speed of four Pandas alternative libraries - Dask, Modin, Ray, and Vaex - on a large dataset, comparing their performance in various data processing tasks such as computing mean, standard deviation, and unique values, as well as grouping and aggregating data.
Full Transcript
in this channel we talk a lot about using python for data science and the main package that we use a lot is pandas but there's a lot of times where pandas seems to be inefficient and slow especially when working with extremely large data set and often i'll see people commenting saying that there are better alternatives than pandas that we can use in those cases but how do these packages compare to each other well today's video we're going to run a test of some of the most popular alternatives to panning so here i am in a jupiter notebook now this isn't going to be a complete comparison and every different data set comes with its own problems it also depends on the machine that you're running on but i think this will give give us a good idea of the benefits of each we're also going to be cutting a lot in this video because the time that it takes to run some of these cells is a while and i don't think you want to wait around for them so we'll fast forward through those but the main ones we're going to look at are das ray moden and veyet some of these actually rely on each other so some of them are architectures that are used by each other but i was starting to understand this by reading this article that's out there about comparing pandas versus desk versus vayx and actually they talk about rapids which is an alternative that uses gpus so we're only going to be looking at dax vx moden and ray but you can see here they give some reasons why in that article they think certain ones are more either mature in the code base or popular but we're going to give it a try for ourselves and see how things go so i am going to install pandas and numpy from scratch just by running pip install and then i'll show you here the versions that i'm running as of today and then the data set that we're going to be working with this data set is a massive parquet file that holds all the history of reddit place and if you don't know what reddit place is all you need to know is it's a really big data set that holds positions in pixels in a big canvas and when people clicked on those so this file is 16 gigabytes in size and it's not too big for my computer's memory but it'll be good for running these tests now of course if the data is too large for memory you're not going to ever going to be able to open it in pandas so it's not really a fair comparison and some of the tests that i want to run on these first just reading in the file then taking one column and seeing if we can compute something like the mean or standard deviation and we're also going to do a unique count for a column to see how long that takes and do something like a cumulative sum where the algorithm actually has to take each value and add the previous values to it and then we're going to do a group by aggregation so we're going to group by the user column in this and then find the average per user and see how long it takes with this massive large data set okay so first one is just reading in this massive parquet file and we're going to do it in panda so this is the first version this is our baseline let's go ahead and read in the file okay so it is done reading it took one minute and 46 seconds to read this large parquet file i used this time method at the beginning of the cell to time how long it took to run it took a while while i was sitting here just waiting for it to run just to show you the size of this file the shape of it is really large we have only five columns but there are 160 million it looks like so different rows in this data set so it's large but not too big for memory let's run the head command on this just to make sure we can see what the data looks like so we have a time stamp column a user id column which is a long hashed user id name a pixel color column an x and a y column so these are the locations and we'll be using these to benchmark how long it takes to run some of these results so let's start with that so we're going to take this x column of this 160 million rows and we're gonna compute the mean of that just using standard pandas that's what we're using right now all right that was really quick 167 milliseconds is pretty fast and we have the mean value here i'm just storing it as underscore but um just printing it here this is the mean value um so i could print this is we can check that later and we can run this again because it was so fast oh look it's even faster that time all right so now let's run the standard deviation done so the standard deviation value is here and that took 1.13 seconds to run now let's take this user id column and let's find the number of unique values there are in the user id column so this might take a little bit longer and let's try it okay so that one's done to find the unique user ids and i just printed the length of that so there are uh looks like 10 million unique user ids but to find that in this large data set took one minute and 17 seconds and now we're gonna do the cumulative sum all right that was surprisingly fast 1.09 seconds and the last test i want to do is a group by function so we're going to group by all the users in this data set and find for each user the average x value and that one's done so that took the longest out of everything two minutes and two seconds so i'm just gonna quickly here summarize the results for pandas the summary results uh reading the parquet group i mean and finding the unique ids took a while everything else was pretty quick once the data was in memory so we're going to compare first here to something called ray ray is a low level framework for paralyzing python code so it's not necessarily a drop-in replacement for pandas but we can go here to raise website and it looks like they have something called ray data sets which will let us read in files and we'll try to do some of these aggregations as much as we can next i imported ray and i'm printing the rave version so we know looking in the ray docs it does look like they have a read par k so let's see how this compares to pandas and we will call it ray dataset and run a time command on it now one thing to notice is we have now this ray dashboard that we can look at the ray dashboard shows me some of the things being used by this local computer it can be run on multiple machines so i think that's why we can group these by the host and actually see what each of my cpus is doing it looks like so looking at this data set it is a called data set can i run a head command on this no i can't i'm looking at the docs and it looks like i can run a dot schema to see all the different values in here so we do have the x y the pixel color again looking at the dots it looks like here that we to find the mean value of the x value we'd have to run this aggregate function on this ray data set and i want to make sure i time this so let's run this timed so remember how quick pandas took to take the average value of this x column and keep in mind that's because that was already loaded into memory and it appears like this might be reading in the data frame while it's trying to aggregate the mean value so when we ran in read in this data set this five seconds may have not actually pulled in the data into memory this is also referred to sometimes as a lazy evaluation we'll see it in the other packages five minutes later okay so it's been a while and i had planned on running this mean and then the standard deviation but honestly it's taken too long for me to wait for it i'm not sure what's going on in this ray dashboard but at least for this type of problem we can already see that trying to run just an average value on a single column ray is probably not what it's intended for so i'm going to go ahead and stop this so i'm going to try to run the standard deviation on the x column like we did before just by using this syntax and i think it should do it similarly it looks like the dashboard is doing something but i'm not quite sure why it's taking so long okay this has been running for a while also so i'm just gonna kill it um i as i hit kill it it looks like it has a countdown going for two minutes which is much longer than it took for the pandas so we're just gonna continue on what we're realizing is that for a data set that can fit into memory ray is not what it's intended for at least not the data set api we're going to look at mode in later which actually uses ray at as a back end so maybe that'll be a better replacement so we're going to skip over for ray and just look at this group by aggregation so it looks like doing a group by and then an aggregation of the mean value may work and i think the syntax is just a little bit different now keep in mind this took a group two minutes for the pandas code to work but as i look it doesn't look like this it's using many of the cpus now it looks like it's using 11 but still i would think it would use most of my cpus if it's able to do it parallel and the result is for some reason there mu there's an error um something about concatenating a raise so this is not a good sign it could be an issue with my setup although i'm not quite sure what it would be but i think we're going to go ahead and say ray on its own for this application at least was not a success so nothing worked is the simple result let's move on here to using desk so looking here at the desk website they provide advanced parallelism for analytics it looks like they do things like numpy similar to pandas and psychic learn so hopefully we'll have a little bit more success with using desk and i'm going to import it and print the version it looks like they do versioning by the months so this is the beginning of 2022 go ahead and read it in using dd for desk data frame all right so that ran in super fast and the reason why is it is because it actually hasn't read in the file into memory yet it will only do that once it we run something like this head command and let's go ahead and run that and see how long this takes okay there we go we've run the head command on this das data frame and you can see that this took a long time it took about two minutes and 43 seconds it that's comparable to about the amount of time it took to read in the parquet file into pandas so although running the read parquet function on das data frame was quick that's because it was waiting to actually read it until we ran something like a head command now this can be really helpful in a situation where you actually don't you want to chain your commands and have it run optimized but for something like this it you know it's comparable to pandas let's continue on and run the mean value of this x column in the dash data frame that was pretty quick 5.72 seconds so now that it's read in the data frame the results are pretty fast running the standard deviation of this x column took 5.59 seconds now compare that to the 1.3 seconds it took with pandas now we're going to take the number of unique values in user id okay so we've got the unique values from the user id column and it took over four minutes so it's slower than just using raw pandas now this always confuses me because i know that desk is designed to work for larger data sets and it may be that it's designed more so to work across different nodes but i would think that it would run at least as fast as pandas and that's not the case let's go ahead and keep going and do the cumulative sum okay so cumulative sum computed in about seven seconds so uh didn't have to wait around four minutes that time the last one we want to do is this group by computation five minutes later and we are done so i've been sitting here for a while it's been six minutes and 48 seconds to compute this group by aggregation using desk certainly not faster than panda's out of the box and while that was running i already prepared this summary of all the results and how long they took for each of our tests let's move on to moden is intended to be a drop in replacement for pandas so instead of importing pandas you just import moden now moden on the back end can use dask or ray i guess since we just did desk let's go ahead and have it use rey as our back end let's look here just at one of the summaries that they have about how much faster it is in reading csvs concatenating applying so let's go ahead and run this so we're going to pip install mode in the version number of modem that i'm running is point 14.0 and we're going to import moden as pd and then we're going to initialize ray why don't we go ahead and as they say in the documentations ensure that uses ray as the back end and we will run the inet and we have this ray dashboard again similar to when we just ran the ray back end so let's go ahead and time the reading in you can see in the dashboard stuff's going on has taken 3 minutes and 45 seconds to load in the data frame let's see if running the head command is quick on it and yes it is it just takes uh two milliseconds to run head oh wait it's still doing something so i thought that running the head command would work uh it executed but then it looks like we had some issue with the back end and we have to restart rey i'm not quite sure but let's just continue on so let's see if we can get the mean value of the x column yes and it worked and it was fairly quick similarly the standard deviation 5.75 seconds using moden to calculate the unique user ids got the unique user ids in two minutes 47 seconds cumulative sum very quick and this group by aggregation okay so moden ran this group by in four minutes and 44 seconds and i've put my mode in results here let's move on to our last alternative to pandas and that is called vx it says vx is a python library for lazy out of core data frames similar to pandas to visualize and explore big tabular data sets perfect that's what we have right here is a big tabular data set it's not in the billionth dimension but let's see how it performs in our benchmark and i'll make sure i start from scratch by installing it looks like there's a lot of different versions here so we have vixx jupiter core hdf5 let's do our first test which is reading in this data frame this parquet file we use vx.open and that happened very quickly let's see it's because if it's because of the lazy evaluation so we'll run a head command on this i can assure you it did not take a long time but it was not this 758 microseconds does look similar to pandas in that manner let's go ahead with our comparison here all right so the mean value computed fairly quickly standard deviation was quick as well let's see what unique takes because that took a while on pandas all right so the unique value took 29.5 seconds that's pleasantly a lot quicker than the previous ones and we do see we have a list here it looks like of unique value so it looks like that computed correctly let's run the cumulative sum okay so this is an issue it looks like vex may not have cumulative sum implemented so so i couldn't find if there's cumulative sum in their documents and it looks like it's just not available so it might be a stripped down version of pandas let's go ahead and run this group by mean and looking at their documentation it looks like this group by function is a little bit different than it would look like in pandas so we have to run the group by and then run an aggregation on this x column looks like it's done and it took 1 minutes 22 seconds the results do look like they've grouped by the user id and given us a mean value all right so here are the results for vx surprisingly was faster than i expected i hadn't really heard of x before this and um it did pretty well now cumulative sum does not uh exist in their documentation from what i could tell but other stuff was okay so let's do a final comparison i'm gonna be honest this was one of the most frustrating videos i've put together yet just because of the amount of time it takes to run all this stuff and um this is commonly my feeling when i try to use these alternatives to pandas i may be using it incorrectly so please let me know in the comments below if there's something that i did wrong but at least for this type of application i'm not super excited by the results let's let's gather them together though okay so i've taken all the results and of course i've imported pandas and numpy and created a data frame just by typing in with each test as a row as you can see here the x was actually very fast compared to all the other three in reading which i was surprised by for some reason computing the mean value for desk really took a while while standard deviation for all of them took a lot longer than pandas which was the winner there the unique count vex was the the winner then cumulative sum was really slow for desk and uh moden was actually faster than pandas and finally our group by it looks like pandas and vx are fairly similar and desk and moden are slower so at least my takeaway today from this experiment is that pandas does pretty well on its own even on fairly large data sets on the right machine the x does seem to be promising but it doesn't look like it has implemented everything that pandas has like cumulative sum and the other two das and moden look like they may have benefits in certain situations but definitely not when you have a data set in a machine that i was running it on today so i hope you learned a lot and this will help you in the future when you're deciding if and when to use pandas alternatives until next time please like and subscribe if you enjoy the video have a good one
Original Description
In this video we benchmark some of the python pandas alternative libraries and benchmark their speed on a large dataset. We look at four different libraries: Dask, Modin, Ray and Vaex. Pandas is a very popular library used by data scientists who code in python and other libraries exist that claim to be faster than pandas. We put them to the test and see which is the fastest!
Timeline:
00:00 Intro
00:30 Setup
03:05 Pandas
05:54 Ray
10:24 Dask
13:30 Modin
15:45 Vaex
18:45 Summary
Follow me on twitch for live coding streams: https://www.twitch.tv/medallionstallion_
My other videos:
Speed Up Your Pandas Code: https://www.youtube.com/watch?v=SAFmrTnEHLg
Speed up Pandas Code: https://www.youtube.com/watch?v=SAFmrTnEHLg
Intro to Pandas video: https://www.youtube.com/watch?v=_Eb0utIRdkw
Exploratory Data Analysis Video: https://www.youtube.com/watch?v=xi0vhXFPegw
Working with Audio data in Python: https://www.youtube.com/watch?v=ZqpSb5p1xQo
Efficient Pandas Dataframes: https://www.youtube.com/watch?v=u4_c2LDi4b8
* Youtube: https://youtube.com/@robmulla?sub_confirmation=1
* Discord: https://discord.gg/HZszek7DQc
* Twitch: https://www.twitch.tv/medallionstallion_
* Twitter: https://twitter.com/Rob_Mulla
* Kaggle: https://www.kaggle.com/robikscube
#python #pandas #datascience #dataengineering
Watch on YouTube ↗
(saves to browser)
Sign in to unlock AI tutor explanation · ⚡30
Playlist
Uploads from Rob Mulla · Rob Mulla · 27 of 60
1
 2
2
 3
3
 4
4
 5
5
 6
6
 7
7
 8
8
 9
9
 10
10
 11
11
 12
12
 13
13
 14
14
 15
15
 16
16
 17
17
 18
18
 19
19
 20
20
 21
21
 22
22
 23
23
 24
24
 25
25
 26
26
 ▶
▶
 28
28
 29
29
 30
30
 31
31
 32
32
 33
33
 34
34
 35
35
 36
36
 37
37
 38
38
 39
39
 40
40
 41
41
 42
42
 43
43
 44
44
 45
45
 46
46
 47
47
 48
48
 49
49
 50
50
 51
51
 52
52
 53
53
 54
54
 55
55
 56
56
 57
57
 58
58
 59
59
 60
60

A Gentle Introduction to Pandas Data Analysis (on Kaggle)
Rob Mulla
Exploratory Data Analysis with Pandas Python
Rob Mulla
7 Python Data Visualization Libraries in 15 minutes
Rob Mulla
Kaggle competition starter notebook walkthrough
Rob Mulla
Kaggle Competitions: A Beginner's Guide to Winning
Rob Mulla
Jupyter Notebook Complete Beginner Guide - From Jupyter to Jupyterlab, Google Colab and Kaggle!
Rob Mulla
Audio Data Processing in Python
Rob Mulla
Complete Data Science Project!
Rob Mulla
Make Your Pandas Code Lightning Fast
Rob Mulla
Image Processing with OpenCV and Python
Rob Mulla
Speed Up Your Pandas Dataframes
Rob Mulla
This INCREDIBLE trick will speed up your data processes.
Rob Mulla
Complete Guide to Cross Validation
Rob Mulla
Easy Python Progress Bars with tqdm
Rob Mulla
Economic Data Analysis Project with Python Pandas - Data scraping, cleaning and exploration!
Rob Mulla
Python Sentiment Analysis Project with NLTK and 🤗 Transformers. Classify Amazon Reviews!!
Rob Mulla
Get Started with Machine Learning and AI in 2023
Rob Mulla
The Trick to Get Unlimited Datasets
Rob Mulla
Video Data Processing with Python and OpenCV
Rob Mulla
Object Detection in 10 minutes with YOLOv5 & Python!
Rob Mulla
Pandas for Data Science #shorts
Rob Mulla
Object Detection in 60 Seconds using Python and YOLOv5 #shorts
Rob Mulla
Machine Learning for Facial Recognition in Python in 60 Seconds #shorts
Rob Mulla
Time Series Forecasting with XGBoost - Use python and machine learning to predict energy consumption
Rob Mulla
Detect Text in Images with Python - pytesseract vs. easyocr vs keras_ocr
Rob Mulla
Solving an Impossible Riddle with Code
Rob Mulla
Do these Pandas Alternatives actually work?
Rob Mulla
Time Series Forecasting with XGBoost - Advanced Methods
Rob Mulla
Data Science Uncut - Data Shootout Kaggle Competition (Aug 1 2022 Stream)
Rob Mulla
Kaggle Dataset Creation from Scratch- Data Science Uncut (Aug 10 2022)
Rob Mulla
Chess Board Computer Vision AI - Data Science Uncut (Sep 7, 2022)
Rob Mulla
25 Nooby Pandas Coding Mistakes You Should NEVER make.
Rob Mulla
DEFCON Hacking AI CTF Solution on Kaggle - Data Science Uncut Sep 11, 2022
Rob Mulla
More Chessboard Computer Vision AI - Data Science Uncut - Sep 13
Rob Mulla
Medallion Data Science Live Stream
Rob Mulla
Community Kaggle Competition Overview - Corn Classification (
Rob Mulla
Deep Learning Image Classification - Corn Kernels - Data Science Uncut
Rob Mulla
OpenAI Whisper Demo: Convert Speech to Text in Python
Rob Mulla
Yolov7 Custom Object Detection in Python Tutorial - Chess Piece Detection
Rob Mulla
Live Kaggle Coding - Enzyme Stability Prediction - Data Science Uncut Sep, 27 2022
Rob Mulla
Finding Chess Cheaters with Python! - Data Science Uncut Livestream
Rob Mulla
Data Science Uncut - Kaggle Community Competition & Chess Data Analysis - Oct 4, 2022
Rob Mulla
Flight Delay Dataset Creation (Data Science Uncut)
Rob Mulla
5 Reasons to Kaggle #shorts
Rob Mulla
♟️ Data Science - Chess Data Analysis
Rob Mulla
EXTREME PYTHON & DATA SCIENCE LIVE STREAM
Rob Mulla
What is Clustering in ML?
Rob Mulla
What is K-Nearest Neighbors?
Rob Mulla
LIVE CODING: Flight Data Exploration with Pandas & Python
Rob Mulla
Kaggle Survey vs. Twitter Sentiment
Rob Mulla
If Top Chess.com Players were STOCKS - Live Coding Data Anaylsis Stream
Rob Mulla
Data Visualization BATTLE!
Rob Mulla
LIVE CODING: Stocks & Sentiment Analysis
Rob Mulla
Progress Bar in Python with TQDM
Rob Mulla
Flight Cancellation Data Analysis
Rob Mulla
Synthetic Dataset Creation for Machine Learning - Blender and Python
Rob Mulla
The Ultimate Coding Setup for Data Science
Rob Mulla
Dataset Creation SPEED RUN - Live Coding With Python & Pandas
Rob Mulla
Data Wrangling with Python and Pandas LIVE
Rob Mulla
Forecasting with the FB Prophet Model
Rob Mulla
More on: ML Pipelines
View skill →


Related AI Lessons
⚡
⚡
⚡
⚡
Python for Data Science — Probability Basics for Data Science
Medium · Data Science
Python for Data Science — Probability Basics for Data Science
Medium · Python
The Survivorship Bias in Your Funnel Data: Why Drop-Off Analysis Misses the Point
Medium · Data Science
The Attention Economy: Your Attention Is Worth More Than Gold
Medium · Data Science
Chapters (8)
Intro
0:30
Setup
3:05
Pandas
5:54
Ray
10:24
Dask
13:30
Modin
15:45
Vaex
18:45
Summary
🎓
Tutor Explanation
