NVIDIA Nsight Feature Spotlight: GPU Trace
Key Takeaways
The video demonstrates the use of NVIDIA Nsight's GPU Trace feature for profiling and optimizing graphics applications, with a focus on collecting GPU performance data and analyzing frame-level execution.
Full Transcript
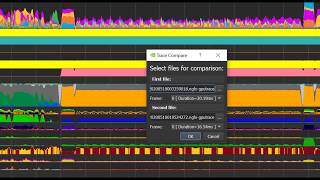
welcome to the GPO dress feature spotlight and video insert graphics is a feature-rich tool the developers can use to debug and profile their graphics applications in addition to providing a frame debug of high profile on the ability to sell frames as a simple as fast capture there is a powerful new GPU trace low-level profiler let's talk about GPU trace GPU trace is a tool that profiles lab applications and gives a breakdown of various GPU unit utilization throughout the frame execution it currently supports digs wealth and Vulcan applications on Windows and Linux GPU trace takes advantage of the special single pass counter capability this capability was made possible by the Turing architecture which is required in order to use it so how does the putress work on our Tech's architecture GPUs are very complex and comprised of many different hardware units that each have a specialized purpose on NVIDIA GPUs there are performance monitor components for each major hardware unit known as PMS these PMS give us a good indication of the UN support and utilization when disability has been there for a while in Turing GPUs our architecture team expanded this capability and we can now collect more of this data in a single frame GPU trace leverages this capability and collected data with minimum intervention of the application execution which makes it a low overhead non-intrusive powerful profiler some form of the GPU side retrace to appear in a totalization foot boot from the application side with rack synchronization objects vocals this witch's execute command is perd acute was executed on add to these superb markers and you've got a very accurate overview of the frame execution on the GPU and a breakdown of the GPU unit utilization throughout the frame duration you have the option of refining a single frame or multiple consecutive frames let's get familiarized with GPRS once you've installed and said graphics the best practice is to create a new project so all relevant settings are saved for later use in the connection dialog choose the GPU trace activity and application executable path command and arguments and environment variables if applicable you can setup the number of frames that you want to profile let's leave the metric set to the default throughput settings we recommend keeping vsync off for real-time profiling and running with lock lock - based checked this will enable you to bet on compare traces from different trends click Launch reboot race and application will be launched it is recommended to run your application in a full-screen mode once application is ready click the f11 hotkey from a remote machine click generate ripio trace capture button to create a new trace in the trace file there are three areas of interest the Timeline view matrix and information tab and ranges table in the timeline view you can see synchronization objects barriers actions and markers and matrix information the summary tabs show top throughput information or you can switch to the metrics tab to quickly search for specific metric the range is table summarizes all ranges by type and correlate the information with both the timeline view and the metrics tab it is also possible to add the user ranges this information will be stored in the trace file and can later share with others here is the trace of Wolfenstein Youngblood before it is released this title is using Vulcan for its graphics API let's observe this trace and examine it according to the peak performance potential lines this method also known as the p3 method the first thing to notice is the GPU active which indicates the number of cycles for the graphics all compute engine were active in percent if it is lower than 95 percent it indicated was 5 of the time where the GPU was fully idle and hence it is recommended to switch first to incite systems to see what on the CPU side is limiting the performance in this example GPU active for the frame is 99% so we should continue with repeat race let's examine the trace race range GP active is one hundred percent so next we should observe the units for put top unit is VM for put which is only thirty percent it is very low and may indicate the performances latency limited by the VM to observe that we should reduce VM accesses by either increase cache it rates or reduce texture formats note that on all NVIDIA GPUs all VM traffic's goes for the l2 cache so a breakdown of what requests are made to the film from the l2 cache can really help to understand what changes are best to do to overcome the VM limiter in the full put matrix mode we do not have this information the way to obtain this data a food advanced matrix mode let's examine that vance mode so we know what is the limiting range and what unit has allowed for put but we're still not sure what to change in order to fix the issue this is why we have the Advanced Mode in GPU trace in this mode we will capture frames each time with different matrix set the additional counters collected give us a better indication of the why is this unit so poorly performing to activate it simply choose the advanced mode matrix set keep in mind that this is a longer operation but you can also change the matrix set while the application is running some no need to relaunch the application let's see what we discover when we switch to advanced mode in our Wolfenstein youngblood example to capture a new trace using the advanced mode matrix we need to open the connection dialog and set a matrix set to the advanced mode if you kept your application running after the previous capture you can also switch conflicts while there education is running and save the time of freelanced application you may notice that this operation takes longer time make sure to not move the game or freeze it if you can let's observe the results here is that when small trace of the game we immediately noticed additional sections in the summary tab with Rob issue and LUN stalled since we saw that the veeram throughput is low we want to understand better l2-cache breakdown it can give us an indication of what we need to change in our application the matrix that give this type of information are the l to associate matrix family those metrics show the proportion of L to sectors per unit from the given results in this example the top unit is L to associate X rayed this value means at eighty four point eight percent of the transfer bite-through the l2 cache originated from any one text read so we know that the best way to reduce the number of random access is to reduce the number of read buys requested by l1 text by observing the hit rates we see that the l1 tech sector hit rate value is 75 percent and the l2 read hit rate from l1 text value is 49 put 8% this poor l2 hit rates implies that the l1 tax rates are thrashing the l2 cache which typically happens because the working set size of simultaneously executing l1 text reads is much greater than the l2 cache size fixing the issue it turns out that the hitch headers of this ray tracing workload were fetching all 2d textures with mid level hard-coded to zero a well-known way to reduce the l2 walk instead size of the 2d texture fetches is to use mipmapping because only mid levels that are accessed are resident in l2 and a coarser level occupy less bytes mid maps were already populated by the engine so all we needed to do was to replace the hard-coded nib equals 0 with some dynamic mid level more information of the technique taken found in a blog here is the trace taken after the fix a good way for before-and-after comparison is by launching the trace compared to the easiest way to launch it is by choosing the two files you would like to compare right-click and select the trace compare you can also identify which frames you would like to compare in in case you traced multiple frames the tool shows frames one above the other and correlates the timeline so if you select a specific marker it will automatically select the corresponding marker in the other frame in the metrics pane you can see the values and absolute Delta back to our Wolfenstein example in this example we have reduced the time of the trace rays marker by 12% as to read hit rate from l1 text improve greatly from 50% to 83 and the l1 tech sector hit rate also slightly improved in conclusion if you'd like to understand the performance limiters of a frame you can use the putress for that once you figured that you are not cpu limited you can use that vents mode to apply the P 3 method to derive the main performance limiters of that workload thank you for watching GPU trace feature spotlight you can download the latest inset graphics from Nvidia developer site and also visit the useful links below
Original Description
Check out our latest feature spotlight on GPU Trace, a new frame-level profiler for graphics applications within NVIDIA NSight. With GPU Trace on #RTX, developers can collect GPU performance data on a single pass.
- Download the latest version of Nsight Graphics: https://nvda.ws/3deeXrP
- Visit Louis Bavoil’s blog for the Peak-Performance-Percentage Analysis: https://nvda.ws/2zQvLro
Watch on YouTube ↗
(saves to browser)
Sign in to unlock AI tutor explanation · ⚡30
Playlist
Uploads from NVIDIA Developer · NVIDIA Developer · 23 of 60
1
 2
2
 3
3
 4
4
 5
5
 6
6
 7
7
 8
8
 9
9
 10
10
 11
11
 12
12
 13
13
 14
14
 15
15
 16
16
 17
17
 18
18
 19
19
 20
20
 21
21
 22
22
 ▶
▶
 24
24
 25
25
 26
26
 27
27
 28
28
 29
29
 30
30
 31
31
 32
32
 33
33
 34
34
 35
35
 36
36
 37
37
 38
38
 39
39
 40
40
 41
41
 42
42
 43
43
 44
44
 45
45
 46
46
 47
47
 48
48
 49
49
 50
50
 51
51
 52
52
 53
53
 54
54
 55
55
 56
56
 57
57
 58
58
 59
59
 60
60

Ray Tracing Essentials Part 2: Rasterization versus Ray Tracing
NVIDIA Developer
Ray Tracing Essentials Part 3: Ray Tracing Hardware
NVIDIA Developer
Ray Tracing Essentials Part 4: The Ray Tracing Pipeline
NVIDIA Developer
NsightGraphics 2020 2 Release Spotlight
NVIDIA Developer
Ray Tracing Essentials Part 5: Ray Tracing Effects
NVIDIA Developer
Ray Tracing Essentials Part 6: The Rendering Equation
NVIDIA Developer
Ray Tracing Essentials Part 7: Denoising for Ray Tracing
NVIDIA Developer
Spatiotemporal Importance Resampling for Many-Light Ray Tracing (ReSTIR)
NVIDIA Developer
Announcing Cloud-Native Support for Jetson Platform
NVIDIA Developer
JetsonTV: Build your next project with NVIDIA Jetson
NVIDIA Developer
Nsight Compute Feature Spotlight: Roofline Analysis, Asynchronous Copy, Sparse Data Compression
NVIDIA Developer
Nsight Systems Feature Spotlight: OpenMP
NVIDIA Developer
Isaac Sim 2020: Deep Dive
NVIDIA Developer
NVIDIA Jetson: Enabling AI-Powered Autonomous Machines at Scale
NVIDIA Developer
NVIDIA Tools to Train, Build, and Deploy Intelligent Vision Applications at the Edge
NVIDIA Developer
Jetson Xavier NX Developer Kit: The Next Leap in Edge Computing
NVIDIA Developer
Synthesizing High-Resolution Images with StyleGAN2
NVIDIA Developer
NVIDIA Robotics: Isaac SDK and Sim 2020.1
NVIDIA Developer
Accelerating COVID-19 Research with GPUs
NVIDIA Developer
Visualizing 150 Terabytes of Data
NVIDIA Developer
Boosting Performance and Utilization with Multi-Instance GPU
NVIDIA Developer
Running Multiple Workloads on a Single A100 GPU
NVIDIA Developer
NVIDIA Nsight Feature Spotlight: GPU Trace
NVIDIA Developer
Spark 3 Demo: Comparing Performance of GPUs vs. CPUs
NVIDIA Developer
NVIDIA Jetson Nano Wins Edge AI and Vision Alliance Award
NVIDIA Developer
NVIDIA IndeX on Google Cloud Platform Marketplace
NVIDIA Developer
DeepStream SDK: Best practices for performance optimization
NVIDIA Developer
Efficiently Deploying GPU Accelerated 5G CloudRAN for Edge AI Inferencing
NVIDIA Developer
NVIDIA PhysicsNeMo - Accelerating Scientific & Engineering Simulation Workflows with AI
NVIDIA Developer
NVIDIA Deep Learning Institute Instructor-Led Training Available Remotely
NVIDIA Developer
Advancing AR Glasses
NVIDIA Developer
Blender Cycles: RTX On
NVIDIA Developer
Real-Time GPU-Accelerated Data Analytics of 250 million Flight Data Records of 737 Max grounding
NVIDIA Developer
Assessing Property Damage with AI
NVIDIA Developer
RAPIDS: GPU-Accelerated Data Analytics & Machine Learning
NVIDIA Developer
DaVinci Resolve Turns RTX On
NVIDIA Developer
RAPIDS with Plotly Dash : GPU-Accelerated Census 2010 Visualization
NVIDIA Developer
NVIDIA IndeX for arivis5D Cloud Platform
NVIDIA Developer
NVIDIA Backchannel: Behind the Scenes of Marbles at Night RTX
NVIDIA Developer
NVIDIA Backchannel: Sneak Peek into Marbles RTX in Omniverse
NVIDIA Developer
How to Create "Paint" in Substance Painter
NVIDIA Developer
Accelerate AI development for Computer Vision on the NVIDIA Jetson with alwaysAI
NVIDIA Developer
Securing Next Generation Apps over VMware Cloud Foundation with Bluefield-2 DPU
NVIDIA Developer
Accelerated Data Centers with NVIDIA and VMware
NVIDIA Developer
GPU-Accelerated Motion Blur in Blender Cycles
NVIDIA Developer
NVIDIA Clara Guardian Virtual Patient Assistant
NVIDIA Developer
Revolutionizing Supercomputing with NVIDIA UFM Cyber-AI
NVIDIA Developer
Inventing Virtual Meetings of Tomorrow with NVIDIA AI Research
NVIDIA Developer
Learning a Contact-Adaptive Controller for Robust, Efficient Legged Locomotion
NVIDIA Developer
Getting started with Jetson Nano 2GB Developer Kit
NVIDIA Developer
NVIDIA Jetson Developer Community AI Projects
NVIDIA Developer
Open-source projects on NVIDIA Jetson Nano 2GB Developer Kit
NVIDIA Developer
Real-Time Ray Tracing with Project Lavina
NVIDIA Developer
Jetson AI Fundamentals - S1E2 - Hello Camera
NVIDIA Developer
Develop Optimized Conversational AI Models with NVIDIA NeMo on DGX A100
NVIDIA Developer
Jetson AI Fundamentals - S1E4 - Image Regression Project
NVIDIA Developer
Jetson AI Fundamentals - S2E1 - JetBot Intro and Hardware
NVIDIA Developer
Jetson AI Fundamentals - S2E2 - JetBot Software Setup
NVIDIA Developer
Jetson AI Fundamentals - S1E1 - First Time Setup with JetPack
NVIDIA Developer
Jetson AI Fundamentals - S1E3 - Image Classification Project
NVIDIA Developer
More on: AI Systems Design
View skill →


Related AI Lessons
⚡
⚡
⚡
⚡
When AI Asks for More Electricity Than a Country Can Imagine
Medium · AI
You Are Not Behind. The World Is.
Medium · AI
Career choice with the advent of AI - pure Computer Science or learn software with a background of core engineering area
Dev.to AI
The AI Hype Cycle: Calm Before the Next Breakthrough?
Medium · Programming
🎓
Tutor Explanation