Causation vs Correlation | The Most Confused Concept in Data Science
Key Takeaways
The video explains the difference between correlation and causation in data science using examples, highlighting the importance of understanding the relationship between variables and the potential for hidden factors to influence results. It also discusses the use of AB testing to demonstrate causation and reduce uncertainty.
Full Transcript
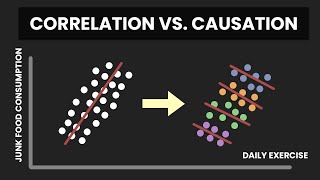
Did you know that as ice cream sales increase, shark attacks also tend to increase? While studying machine learning, you have probably seen correlation heat maps showing relationships between variables. In this case, ice cream sales and shark attacks show a positive correlation. But can we say that if you eat a lot of ice cream, you will be attacked by a shark? Probably not. And there are some important reasons behind this which we will discuss in this video. Correlation is a statistical term that describes a relationship between two variables. When two variables are correlated, it means they tend to change together. This defines association. It means two variables are somehow connected to each other, but we cannot determine whether one causes the other or whether they cause each other. Causation, on the other hand, means that one event directly causes another. For example, if you flip a light switch and the light turns on, flipping the switch causes the light to turn on. Often, what looks like a direct relationship is actually driven by hidden factors. And if you think deeply about how complex different things interact in the world, this will start to make sense. For example, let's take temperature as our hidden factor. During hot summer days, people buy more ice cream to cool down and more people go swimming in the ocean to beat the heat. Logically, the increased number of swimmers raises the chance of shark incidents. If we assume that only these three factors interact with each other without influence from any other variables, then in this simplified scenario, temperature causes both ice cream sales and shark attacks to increase, creating the appearance that these two variables are directly related. This example highlights what is called a confounding variable, a hidden factor that influences both variables you're studying. Without accounting for these, we risk making false conclusions. In data science, confusing correlation with causation can lead to costly mistakes. Imagine you're working for an e-commerce company and you discover that customers who browse the premium watches section tend to spend more overall. If you jump straight to the conclusion that visiting this section caused higher spending, you might redesign the site to push more people there. But what if the real reason is that wealthier customers both like browsing premium watches and tend to spend more in general? Here, customer income is the confounding variable, not the watches. So, you probably want to uncover causation more than association. But in data science, demonstrating causation requires stronger evidence. As a content creator, I might want to optimize my thumbnails to get more clicks on my videos. If I simply post the video with thumbnail A for the first week and then switch to thumbnail B for the second week, I might see that B got more clicks. But can I really say that B caused the increase? Not necessarily, because other factors might have changed. Maybe the second week was a holiday or YouTube recommended my video more or maybe my topic just started trending. A better way to measure causation is to run an AB test. That means I would randomly show thumbnail A to half of my audience and thumbnail B to the other half at the same time. By randomizing who sees which thumbnail, we make sure that other factors like time of day, seasonality, or viewer demographics are evenly balanced between groups. Now, if I see that thumbnail B consistently gets a higher click-through rate across both groups, I have much stronger evidence that the design of the thumbnail itself is what's causing the difference, not some hidden variable. But here's the thing. Even with a perfectly designed AB test, we can rarely claim pure 100% certain causation. There's always the possibility that some unknown factor we didn't measure is still influencing the results. The goal is to reduce the uncertainty as much as possible and make well-informed decisions based on the best available evidence. Subscribe and like the video if you enjoyed it. There are great topics yet to cover.
Original Description
#ai #ml #maths #statistics #education #artificialintelligence #datascience
🔥 Causation and Correlation are two of the most misunderstood ideas in Data Science, Machine Learning, and Statistics. In this video, we explain the difference between them using clear and simple examples. Understanding this difference is very important if you want to analyze data correctly and make well-informed decisions based on evidence.
Many people see two things changing together and assume that one must be causing the other. But in most real-world situations, that’s not the case. Different variables often interact with each other in complex ways. Sometimes, a hidden factor — called a confounding variable — affects both variables and makes it look like they are directly related.
The video also explains how these confounding variables appear in everyday examples, such as temperature affecting both ice cream sales and shark attacks. We then look at how A/B Testing works and why randomization helps remove bias and reveal real cause-and-effect relationships.
🔍 Key points covered:
0:00 - Introduction.
0:28 - What is correlation?
0:47 - What is causation?
0:58 - Why correlation ≠ causation?
1:10 - Confounding variable.
1:50 - Why is that a problem?
2:28 - So, how to uncover causal relationship?
3:10 - A/B Testing.
3:45 - Are we sure about causation?
🔔 Don't forget to like, subscribe, and hit the bell icon to stay updated with our latest videos!
🤖 Note that we use synthetic generations, such as AI-generated images and voices, to enhance the appeal and engagement of our content.
🌐 If you have any questions or topics you want us to cover, leave a comment below. Additionally, share with your thoughts about the content, how do you think we can make them better? Thanks for watching!
Watch on YouTube ↗
(saves to browser)
Sign in to unlock AI tutor explanation · ⚡30
Playlist
Uploads from AI For Beginners · AI For Beginners · 32 of 32
← Previous
Next →
1
 2
2
 3
3
 4
4
 5
5
 6
6
 7
7
 8
8
 9
9
 10
10
 11
11
 12
12
 13
13
 14
14
 15
15
 16
16
 17
17
 18
18
 19
19
 20
20
 21
21
 22
22
 23
23
 24
24
 25
25
 26
26
 27
27
 28
28
 29
29
 30
30
 31
31
 ▶
▶
Artificial Intelligence Explained In Simple Words | What Is AI? | Explained On A Real World Example!
AI For Beginners
AI vs. ML vs. DL vs. DS - Difference Explained | On Real World Examples | AI For Beginners
AI For Beginners
Types Of Machine Learning Algorithms | Explained On Real World Examples | ML For Beginners
AI For Beginners
Best AI Music Generator | Music Generation Tool for FREE | MusicGen developed by Meta AI
AI For Beginners
The Ultimate Guide To Supervised Learning | Explained On Binary Classification Example | Part 1
AI For Beginners
The Ultimate Guide To Supervised Learning | Classification And Regression | Part 2
AI For Beginners
Linear Regression Explained | A Beginner's Guide To Regression | The Basics You Need to Know!
AI For Beginners
Assumptions Of Linear Regression | What To Do If The Assumptions Do Not Hold? | Part 1
AI For Beginners
Checking The Assumptions Of Linear Regression | Statistical And Visual Methods | Part 2
AI For Beginners
The Purpose of Train-Test Split in Machine Learning | How to Correctly Split Data?
AI For Beginners
The Role of Validation Sets in Model Training | Train-Test-Validation Splits | Clearly explained!
AI For Beginners
Overfitting and Underfitting | Bias and Variance Tradeoff in Machine Learning | Clearly Explained!
AI For Beginners
Gradient Descent Explained | How Do ML and DL Models Learn? | Simple Explanation!
AI For Beginners
Main Types of Gradient Descent | Batch, Stochastic and Mini-Batch Explained! | Which One to Choose?
AI For Beginners
The Role of Loss Functions | Most Common Loss Functions in Machine Learning | Explained!
AI For Beginners
How to Evaluate Your ML Models Effectively? | Evaluation Metrics in Machine Learning!
AI For Beginners
8 Best Tips For Cleaning Your Data | Data Cleaning | Machine Learning, Data Preparation.
AI For Beginners
Numerical vs. Categorical Data | Represent Your Dataset Correctly!
AI For Beginners
3 Main Types of Missing Data | Do THIS Before Handling Missing Values!
AI For Beginners
7 PROVEN Strategies To Become An AI Engineer (2025 Updated)
AI For Beginners
Easiest Guide to K-Fold Cross Validation | Explained in 2 Minutes!
AI For Beginners
Normalization and Standardization | Why to Scale the Features? | ML Basics
AI For Beginners
The Ultimate Guide to Hyperparameter Tuning | Grid Search vs. Randomized Search
AI For Beginners
How is Artificial Intelligence different from Traditional Programming?
AI For Beginners
All Machine Learning Models Clearly Explained!
AI For Beginners
6 Mistakes to Avoid When Learning Machine Learning in 2025
AI For Beginners
Best Practices for Effective Data Visualization In Machine Learning!
AI For Beginners
Central Limit Theorem Intuition Explained Like You're 5!
AI For Beginners
Which Door Would You Choose? | Monty Hall Problem Explained!
AI For Beginners
All Machine Learning Concepts Explained in 18 Minutes!
AI For Beginners
What’s the Probability That Two Randomly Drawn Chords in a Circle Intersect?
AI For Beginners
Causation vs Correlation | The Most Confused Concept in Data Science
AI For Beginners
More on: ML Maths Basics
View skill →


Related Reads
Chapters (9)
Introduction.
0:28
What is correlation?
0:47
What is causation?
0:58
Why correlation ≠ causation?
1:10
Confounding variable.
1:50
Why is that a problem?
2:28
So, how to uncover causal relationship?
3:10
A/B Testing.
3:45
Are we sure about causation?
🎓
Tutor Explanation
