Tutorial 25- Probability Density function and CDF- EDA-Data Science
Skills:
ML Maths Basics90%
Key Takeaways
Explains Probability Density Function and CDF in EDA for Data Science
Full Transcript
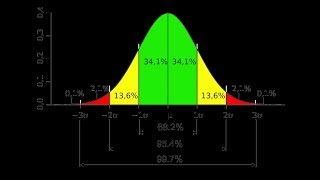
hello my name is krishna a welcome to my youtube channel today in this particular video we will be discussing about probability density function and this is a very important concept in statistics will try to understand how exactly it is created what is the exact use of probability density function and how does it help us now when I go to this probability density function in my previous section I have already discussed about histogram so this is how my histogram basically looks like I've used the feature height and weight in my data set and this is basically my output and I am just considering weight feature and I am trying to plot all the points in the form of histograms if you don't know about histograms I just see my previous video in this particular playlist itself you'll be able to understand now histogram in the y-axis actually says that how many points are basically present within this range suppose this this is between 70 to 80 weight okay 90 100 110 120 130 so here you can see that suppose I say between 70 to 80 weight from this particular thing you can see it you can say that there are five values that are present okay between 80 to 90 there are some 10 values that are present between 90 to 100 they are around 12 values that are present so somewhere like this we can basically plot in the form of histogram now if I want to convert this into a probability density function there will be of varies or you can also say that we are trying to smoothen the histogram when we smoothen the histogram will be getting a curve something like this okay so when we smoothen it and this resembles like a bell curve bell curve now suppose if I have so many points based on a domain knowledge of weight weight is also a Gaussian distribution so we are actually getting this kind of bell curve but that is not what I am trying to explain over here we are trying to understand what exactly is probability density function now as soon as I draw this particular bell curve this count value will get removed in the y-axis okay now this will say that percentage of the distribution this y-axis will now become percentage of the population or I can in a lot say population I'll say percentage of the distribution now we will try to understand what exactly it is so I'm just going to remove all the six understand that but if I consider this point okay and this may be between 60 to 70 suppose if I consider at this point I want to find out the y-axis it basically says that within this range what is the total population what is the total percentage of this distribution that are present in this location okay sorry it should not be percentage of population but understand that how much how what is the percentage of the distribution that are present in this particular region okay percentage of distribution basically is how many point suppose here are so many points within this so many points what is the percentage of the points that are basically located in this particular region and suppose I found out that okay this values point one this basically indicates that 10% of the distribution is present in this location suppose I consider for this particular point over here I want to find out what is the total percentage of the distribution that is present over here now I will combine this region this whole region I will try to combine and finally I will find out okay 0.25 is the total percentage of the distribution that is present over here and similarly we do it for each and every location suppose this this this this is what this y value basically says because they are so many confusion still students have that what is actually present in the y axis understand guys percentage of the total distribution that are present within that particular location suppose if I consider at this particular point then I will try to see this distribution part okay and probably it will be around 50 percent that is 0.5 okay and when we combine all these things with respect to all these particular points it will be giving us around 100 percent this cannot go more than hundred percent try to understand in that particular way it cannot go that basically means it cannot be more than 1 it will be between 0 to 1 okay and this is what is the PDF function this is basically a PDF probability density function okay now there is one more concept which is called as cumulative density function which is called as CDF right that is that is little bit different when compared to PDF understand CDF how it works okay so I am just going to rub this particular diagram now let us go ahead and try to understand about cumulative density function this is my PDF case okay now suppose how what is CD our CDF as the terms is cumulative density function okay cumulative density function or cumulative distribution functions also you can say now in CDF what will happen is that suppose for this particular point that I see over here it is point one okay now suppose for this particular point I want to find out what is the total value that basically means I have to add this point one and whatever value suppose this is ranging towards 0.25 okay suppose this is ranging towards 0.25 now I have to add this value when I add this value the total will be 0.25 plus 0.1 which is nothing but 0.35 now my cumulative density function will be having a line like this okay because I'm adding these two points and with respect to each and every point I'll be adding and finally we'll be seeing a curve something like looks like this okay it'll be a will be having a curve and this is what a curve of a cumulative density function looks like you know at the end of the time the slope will become a little bit straight why because the points are falling this values will become lower and this is how a cumulative rule function basically indicates is basically indicating okay now you can see over here over here you'll be able to see 0.35 0.55 0.75 to 0.85 0.9 something like that okay now understand suppose I take 130 and I try to populate a point out over here and suppose I get 90 percentage of the value is over here with respect to this particular point now what does this indicate this indicates that 90 percentage of the distribution in this particular data set is less than 130 kgs this is what a cumulative density function basically indicates you know 90 percentage of the distribution because why I am getting 90% because when I plot this particular point over here I'm getting point lying value right and this is all added up you can see that it is getting added up so my value is basically increasing every time this this point 1 what added with 0.25 I got point 35 right again when I go up that value will also get added I will get 0.5 five point seven five point eight point nine five 0.9 now this point nine basically indicates that suppose if I plot this particular point over here I stretch it to the y-axis it'll show us 0.9 this basically indicates that 90 percentage of the distribution is less than 130 kg that also indicates that 10 percentage of the distribution in this particular weight feature is greater than 130 kg what a wonderful analysis right we are able to understand so many things with the help of cumulative density function and PDF that is my probability density function isn't it amazing right so this is what exactly CDF what exactly is PDF there's whole lot of use cases with respect to this this all information is basically analysis what we say it has exploratory data analysis so yes this was all about this particular video I hope you like this particular video in this particular video we'll understood what is a probability density function and what is the cumulative density function that is CDF we understood it in depth we understood or each and every thing over here if you have any queries please do write your queries in the comment box I would be very happy to help you out so yes this was all about this video video I hope you liked this please do square channels are not already subscribe please share with all your friends whoever require this kind of help I'll see you in the next video have a great day thank you one and all
Original Description
Please join as a member in my channel to get additional benefits like materials in Data Science, live streaming for Members and many more
https://www.youtube.com/channel/UCNU_lfiiWBdtULKOw6X0Dig/join
If you are looking for the best online course in Data Science with placement assistance. Apply for appliedAI Course
www.appliedaicourse.com
Connect with me here:
Twitter: https://twitter.com/Krishnaik06
Facebook: https://www.facebook.com/krishnaik06
instagram: https://www.instagram.com/krishnaik06
Watch on YouTube ↗
(saves to browser)
Sign in to unlock AI tutor explanation · ⚡30
Playlist
Uploads from Krish Naik · Krish Naik · 0 of 60
← Previous
Next →
1
 2
2
 3
3
 4
4
 5
5
 6
6
 7
7
 8
8
 9
9
 10
10
 11
11
 12
12
 13
13
 14
14
 15
15
 16
16
 17
17
 18
18
 19
19
 20
20
 21
21
 22
22
 23
23
 24
24
 25
25
 26
26
 27
27
 28
28
 29
29
 30
30
 31
31
 32
32
 33
33
 34
34
 35
35
 36
36
 37
37
 38
38
 39
39
 40
40
 41
41
 42
42
 43
43
 44
44
 45
45
 46
46
 47
47
 48
48
 49
49
 50
50
 51
51
 52
52
 53
53
 54
54
 55
55
 56
56
 57
57
 58
58
 59
59
 60
60

Natural Language Processing|Stemming
Krish Naik
Natural Language Processing|BagofWords
Krish Naik
Gaussian distribution or Normal Distribution in statisctics
Krish Naik
Natural Language Processing|TF-IDF for Machine Learning| Text Prerocessing
Krish Naik
Log Normal Distribution in Statistics
Krish Naik
Covariance in Statistics
Krish Naik
Confusion matrix, Precision, Recall| Data Science Interview questions
Krish Naik
Tutorial 44-Balanced vs Imbalanced Dataset and how to handle Imbalanced Dataset
Krish Naik
Implementing a Spam classifier in python| Natural Language Processing
Krish Naik
Tutorial 11-Exploratory Data Analysis(EDA) of Titanic dataset
Krish Naik
Face Recognition using open CV and VGG 16 Transfer Learning
Krish Naik
Pedestrian Detection using OpenCV from Videos
Krish Naik
Face and Eye Detection from Videos using HAAR Cascade Classifier
Krish Naik
Reading, Writing and Displaying images with Opencv| OpenCV Tutorial
Krish Naik
OpenCV Installation | OpenCV tutorial
Krish Naik
Face and Eye Detection from Images using HAAR Cascade Classifier
Krish Naik
Car Detection using HAAR Cascade and Opencv from Videos.
Krish Naik
Using OpenFace for Face recognition in Keras
Krish Naik
OpenPose Tutorial with Tensorflow
Krish Naik
Multiple Linear Regression using python and sklearn
Krish Naik
Dimensional Reduction| Principal Component Analysis
Krish Naik
Movie Recommender System using Python
Krish Naik
TPR,FPR,FNR,TNR, Confusion Matrix
Krish Naik
Precision, Recall and F1-Score
Krish Naik
Artificial Neural Network for Customer's Exit Prediction from Bank
Krish Naik
GridSearchCV- Select the best hyperparameter for any Classification Model
Krish Naik
RandomizedSearchCV- Select the best hyperparameter for any Classification Model
Krish Naik
K Nearest Neighbor classification with Intuition and practical solution
Krish Naik
K Means Clustering Intuition
Krish Naik
Create custom Alexa Skill- Lambda function- Part2
Krish Naik
Hierarchical Clustering intuition
Krish Naik
Implement Transfer Learning with a generic Code Template
Krish Naik
Gender Classifier and Age Estimator using Resnet Convolution Neural Network
Krish Naik
Unlock Your Application With Your Face using OpenCV
Krish Naik
Draw rectangle from webcam and sketch process it on a live feed
Krish Naik
Complete Life Cycle of a Data Science Project
Krish Naik
How we can apply Machine Learning in Finance
Krish Naik
Deep Learning in Medical Science
Krish Naik
How to switch your career to Data Science.
Krish Naik
Linear Regression Mathematical Intuition
Krish Naik
Handle Categorical features using Python
Krish Naik
Machine Learning Algorithm- Which one to choose for your Problem?
Krish Naik
DBSCAN Clustering Easily Explained with Implementation
Krish Naik
Curse of Dimensionality Easily explained| Machine Learning
Krish Naik
Feature Selection Techniques Easily Explained | Machine Learning
Krish Naik
Tutorial 29-R square and Adjusted R square Clearly Explained| Machine Learning
Krish Naik
Cross Validation using sklearn and python | Machine Learning
Krish Naik
Handling Missing Data Easily Explained| Machine Learning
Krish Naik
Deploy Machine Learning Model using Flask
Krish Naik
Deployment of Deep Learning Model using Flask
Krish Naik
How to Visualize Multiple Linear Regression in python
Krish Naik
K Nearest Neighbour Easily Explained with Implementation
Krish Naik
Predicting Heart Disease using Machine Learning
Krish Naik
Predicting Lungs Disease using Deep Learning
Krish Naik
Stock Sentiment Analysis using News Headlines
Krish Naik
Random Forest(Bootstrap Aggregation) Easily Explained
Krish Naik
Voting Classifier(Hard Voting and Soft Voting Classifier)
Krish Naik
Credit Card Fraud Detection using Machine Learning from Kaggle
Krish Naik
Hyperparameter Optimization for Xgboost
Krish Naik
Tutorial 45-Handling imbalanced Dataset using python- Part 1
Krish Naik
More on: ML Maths Basics
View skill →


Related AI Lessons
⚡
⚡
⚡
⚡
X now offers an MCP server to make its platform easier for AI tools to use
TechCrunch AI
n8n Automation Repurpose Video Content: The 2025 Production Guide
Dev.to AI
You’re Still Paying $200/Month for AI Tools You Could Replace With a Free Local Setup Tonight
Medium · Data Science
Top 10 AI Tools Every College Student Should Know in 2026
Medium · AI
🎓
Tutor Explanation
