Live Day 3- Intermediate Statistics With Python In Data Science
Skills:
ML Maths Basics80%
Key Takeaways
Covers intermediate statistics with Python in data science using various libraries and techniques
Full Transcript
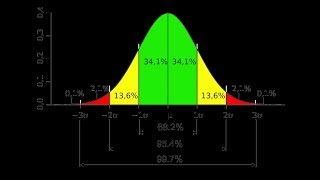
hello guys am i audible an audible everyone hello hi hi hi hi hello so we will be continuing the session what we had left today and uh we'll just wait for some time probably to pick up some questions you know till then you just have to hit like okay and uh today is the day three okay so we are just waiting for everybody's to join okay so how was the how was the session till now day one and day two i think my team has forgot to drop the mail yeah so day one and day two were all good okay perfect so in today's session we are going to uh probably discuss about distributions different kind of distribution today also i am actually going to write lot of python code so that you will be able to understand various things that we can basically work with data set and all and whatever concepts we have discussed till now everything will be getting covered in those practical things right so yes uh um and this will again be going till friday probably everything that is required you know in data science with respect to data scientist or data analysts will try to cover up all the statistics part okay so we'll just wait for another two minutes uh then we'll probably start because till seven has not been after seven can probably start and uh we can actually do so i'm just going to minimize my screen so yeah now guys what all things we have discussed yesterday please tell me about it what all things we have discussed one of these things we have discussed yesterday yeah what all things we have discussed volume is audible guys please check your connections okay check your laptop and all please please check your laptop and probably but i hope my voice is actually audible because i can hear it from here the volume is quite here the volume i can definitely see it so we are going to see percentiles everything as such and probably discuss about it you know uh try to see a lot of examples and uh you know let's see what all things we can basically cover as such so important topics like distribution all will get covered okay yes percentiles will try to do iqr everything with the help of coding also so coming to the day three day three okay so here i will say that now we are moving to the advanced section of statistics i'll still not say advanced section but i will say intermediate to advanced okay so today what all things we are basically going to discuss uh regarding the agenda first of all i'm going to talk about we're going to discuss about lot of distributions okay now in this distribution you will specifically have something called as normal distribution or gaussian distribution then we will try to discuss about standard normal distribution standard normal distribution okay then probably one more example on z scores we will try to see z scores both with uh uh you know z table there is a concept called a z table and y z scores are actually used then we will discuss about log normal distribution okay then probably we will also discuss about bernoulli distribution burn knowledge distribution then finally we will discuss about binomial distribution and we'll see some examples we'll solve some examples and then whatever practical part is left that we have not covered till now like mean median mode everything will get covered over here so if you want to do mean median mode right we'll try to do with python programming language okay and uh we'll also do variance standard deviation standard deviation the third thing we'll try to create histograms we'll try to create pdfs probability density functions we'll try to understand how does a distribution this normal distribution will look in code we'll try to find out how to find out this iq are using code okay and uh we'll see all these things and some examples of log normal distribution we are going to see okay log normal distributions we are going to see okay so uh we are going to do all these things and uh yeah normally same as gaussian so probably let's see in one and a half hour if i am able to complete this it is well and good but from today the concepts that we are going to learn okay i can also discuss about bar plot not to worry okay bar plot that also will try to discuss about it okay so everybody ready good to go yes or no yes i hope everybody is super fine shall we start okay i can also discuss about violent plot it's okay so whatever things will come we'll discuss about it okay okay perfect so let's go ahead and let's start this session uh let's take god name and start you know so that god after probably this session we will be able to learn a lot of things okay so hit like let's see how many likes will i be able to get today it should be again record breaking okay record breaking should be there and it's every time like that is my red bull you know okay okay guys so let's start the first thing first today we are going to discuss about distributions now what exactly is distributions okay understand distribution of data when i say i have a data set let's say that i have a data set of ages okay like 24 26 27 28 30 32 you know so we have lot of data set now when we have this particular data set always okay always in the first thing that we need to focus on is that how do we basically see this data set in a visualized way okay because obviously this is a continuous data we always we already know that this is a discrete continuous data in this particular case age i'm just going to consider as discrete continuous data now in the case of continuous data what kind of graphs do you see probably you'll be able to understand about that specific data right so if i really want to get one analysis or if i really want to start my analysis i really need to see lot of visualized diagrams and that is where when i consider this entire distribution there are multiple ways to visualize this data through various graphs okay and these graphs can really play a very important role whenever probably we are discussing about uh whenever probably we are creating reports where we are doing exploratory data analysis and many things so let's go towards distribution suppose i have a specific distribution of data i probably want to plot this data through some way let's consider that i want to probably plot this data through some way okay and the best and the easy way that you can probably think about is your histogram right so we have already seen how to create histograms you will be able to create diagrams like this buildings like this right so you will be able to get buildings like this and finally what you do you smooth in this histogram to get some kind of curve okay and this curve right now okay looks like a bell curve okay so considering this let's go to the first distribution the first distribution that i'd like to focus on is something called as gaussian or normal distribution okay gaussian or normal distribution now why as i said y distribution is basically used distribution main purpose is to uh why why this in different different kind of distributions are there so that we can basically have some idea about a data set okay now first of all when we discuss about gaussian or normal distribution most of the time you have seen this kind of distribution in this specific way so here probably you have seen a bell curve okay now this bell curve this is my bell curve now they're very important information when might probably talk about this bell curve this will basically this can be your this just a second this center line that you see can be your mean it can be a median it can be a mode okay so what does this basically mean if i have a distribution and probably this distribution follows this kind of bell curve and one important property of this bell curve is that this side is exactly symmetrical to this side okay so there are many inferential statistics that we will probably be discussing about in the future about this bell curve about this entire distribution or gaussian distribution here you can see that it is exactly similar it is i mean it is exactly symmetrical the right part of the curve when i say consider this particular particular path is equal to this part that basically means that the amount of data that is present in this particular part will also be equal to the amount of data that will be basically present in this part okay so here you can basically see that exactly this forms a bell curve and whenever we have a specific distribution which exactly follows this kind of bell curve we can definitely say this has a normal or gaussian distribution okay so this is basically my normal distribution now why we are specifically focused on this distribution this distribution is very much important because from this we can derive lot of conclusions okay what all different kind of conclusions we can derive that i'll just talk about it now let's go ahead and let's discuss about this distribution always understand whenever let's draw this distribution once again now suppose this is my distribution let's consider that i am very bad at drawing okay so i think i'm good at drawing also okay so this is my i cannot draw a straight line difficult but it will get created okay so this will be a mean median mode then you can go one step towards right second step towards right third step towards right so what is this exactly called standard deviation one step towards the right one step one step or one standard deviation towards the right two standard deviation towards the right three standard deviation towards the right similarly i may have one standard deviation to the left second standard deviation to the left and finally i can also have one more standard deviation to the left this will be very very much important guys please focus on this okay third standard deviation towards right okay now what kind of different conclusions or what kind of uh things we can actually conclude from this kind of graphs okay as i said this side is symmetrical to this side now let's go ahead and discuss about some of the important things in this suppose if i draw this line can i say this is my first standard deviation towards the right and second standard deviation towards the left okay so this is my region of my first standard deviation the center one over here i can basically write it as mu this will basically become mu plus sigma mu plus 2 sigma and this will be just a second mu plus 3 sigma okay similarly here i can write mu minus sigma mu minus 2 sigma mu plus sorry mu minus 3 sigma i hope everybody is understanding this yes what did i write over here because of less space okay because of less space i am just trying to include it in this particular way okay but everybody got understood this specific things right how did i write mu plus sigma mu plus 2 sigma mu plus 3 sigma mu minus sigma mu minus 2 sigma mu minus 3 sigma right so everybody understood this thing right just give me a quick yes yes okay perfect now the first thing that we will probably come up with is called as empirical formula now this is very much important empirical formula now this empirical formula basically says that you really need to understand this 68 95 99.7 percentage rule now what does this basically mean okay what does this basically mean 68 95 99.7 percentile rule okay percentage rule this basically indicates that let's go with 68. within the first standard deviation around suppose if i have some distribution data let's consider that i have a data set which have 100 data points which have hundred data points okay which have 100 data points now what does this basically indicate is that between the first standard deviation between this region in this entire region around 68 percentage of the distribution is present okay around 68 percentage of the entire distribution is present over here that basically means out of this 100 data point 68 data points will be present in this region that is the reason it is basically called as a bell cup that specific region in that central area you have lot of data okay so 68 percentage of the entire data set lies in this region within the first standard deviation okay now coming to the second standard deviation this is something very very important i'll also talk about what you can derive from all these things between the second standard deviation around let's come to the 68 percent this is clear then within the second two standard deviation right within the two standard division region which is this specific region around 95 percentage of the entire data lies in this region okay 95 percentage of the entire data lies in this region and similarly if i go and consider with respect to the third standard deviation which is from here to here around 99.7 percentage of the entire distribution will fall in this region okay so that is the reason why it is basically called as 68 95 and 99.7 percentile loop okay so everybody is clear that basically means now if you have a distribution which is gaussian or normally distributed then this conclusion can definitely made that within the first standard deviation how much data is basically falling within the second standard deviation how much data is falling and within the third standard deviation how much data is basically falling everybody clear with this first standard deviation basically means this is the region first standard one standard deviation to the right sec one standard deviation to the left that combined together is one standard deviation okay first second and third standard deviation please uh understanding this now let's see some examples some of the examples if i talk about like height i'll also show you examples with respect to coding okay so height if i say height height is basically normally distributed who is saying this i am not saying it the domain expert is basically saying it now who is the domain expert in this particular case in this particular case the domain expert is a doctor doctor have taken various samples from different different places and whenever the doctor was constructing this bell curve they it was forming something like this okay like this kind of bell cup and from that he was able to understand he was able to derive right he or she was able to derive that within the first standard deviation how much data is basically falling within the second standard deviation how much data is falling and within the third standard deviation how much data is falling everybody clear with this let's take another example so this was my first example second example if you consider weight weight will also follow a gaussian distribution third i hope everybody knows about iris data set in iris data set if you talk about petal length sepal length it actually follows gaussian distribution okay i will show you practically don't worry about that does that following uh the empirical rule necessary imply that it is distributed see whenever you have a gaussian distributed data at that time it will follow this 68 95 99.7 percentile rule okay so this was the thing with respect to gaussian or normally distributed okay that basically means suppose now let's let's consider one thing let's everybody is clear with this at least shall i start the next topic because from this we will try to derive something which is called as z-score okay everybody is clear with this yes hit the like button i need to see lot of likes now because now i'm going to use multiple colors and show you it in an efficient way okay but everybody's clear with this i'll talk about iris data set if you have not seen iris data set what it is i'll show you practically okay i'll talk about it practically okay don't worry this rules apply to those data set which follow a gaussian distribution or normal distribution like this kind of curve now percentage not percentile okay soviet percentage of the entire distribution okay okay now let's go ahead and try to see this let's take an example okay suppose my i have a data set where my mean is four and my standard deviation is one if i have this two information can i construct a distribution suppose this is 4 then in the next step what it will come 5 6 7 8 right and then 3 2 1 and 0. so i will be able to create this and let's consider that this is basically following this kind of distribution okay so this basically follows this kind of distribution our data is basically distributed normally distributed all we'll discuss all about it don't worry okay everything i roam is not built in one day guys okay it'll take time okay so we have kept the seven days session where you understand each and everything if you want to learn the advanced thing just tell me half an hour i'll complete all the advanced thing then everybody will forget uh what uh needs to be taught you know so when we go from basics you will be able to understand each and everything is it clear or do you want to directly learn uh the last thing tell me should i directly show you the last day seventh day that i'm actually planning to do or do you want to learn in this particular way tell me okay you can tell me okay and based on that i will uh may directly teach you the last day things and then you can go home and probably be confused whenever there is an interview going on right okay now understand this middle one is basically your mean and standard deviation sorry mean is 4 and standard deviation is 1 okay now see one thing guys if i talk about if i talk about 4.5 now tell me my question is that where does 4.5 fall in terms of standard deviation in terms of standard deviation where does 4.5 basically fall tell me where does 4.5 fall in terms of standard deviation okay just tell me so you may be thinking okay 4.5 where exactly it is it is somewhere here obviously when i say 5 is first standard deviation to the right that basically means 4 will be plus 0.5 standard deviation to the right yes everybody is agreeing with this 0.5 standard deviation right understand 0.5 standard deviation if you say 1 standard deviation it is basically coming to 5 right it is 0.5 standard deviation right okay now similarly if i say where does 4.75 fall then how you will be able to see it see point the standard deviation was 1 right i told 4.5 so 4.5 will be something falling over here and this is like 0.5 standard deviation but in the case of 4.75 it will be very much difficult for you to do the calculation right so that is the reason what we can do is that we can use a concept which is called as z score now z score will basically help you find out whenever i talk about a value how much standard deviation away it is from the mean okay so this formula is x of i minus mu divided by standard deviation okay x of i minus mu divided by standard deviation now i need to find out for 4.75 okay so let's go and compute so over here i will just write okay i will just write 4.75 minus mu is what mu is 4 4 divided by standard deviation is 1 so here i am actually getting 0.75 so now i can see that it is 0.75 standard deviation to the right why it is saying right why it is basically said is right why not left why why not left why not left why i'm saying that it is falling here 0.75 distribu standard deviation to the right because this is positive value this is positive value okay now if i give you the same question try to find out where does 3.75 fall like how many standard deviation whether what should be the standard deviation with respect to 3.75 then you go and apply the same formula so here i'll say z score is equal to 3.75 minus 4 divided by 1 which is nothing but minus 0.25 so whenever minus comes that basically means you have to check in this side and it is basically saying that 3.75 will be falling somewhere here that is nothing but minus 2.25 standard deviation to the left right i hope everybody is able to understand this i hope everybody is able to understand this yes or no yes or no if yes definitely hit like and i'll be teaching more many things will be actually coming and i hope you are loving the session i hope you are able to understand with respect to the complexity see understand now you are learning something which will be heavily used somewhere why we are doing this everything will come now okay why why not everything will come everything will make sense to you okay so till here i hope everybody is able to understand okay now let's go to the next thing suppose i consider this same graph now you understood if i really want to find out how many standard deviation to the right or the left i need to find out i can definitely use z score okay now let's consider this thing i will use the same graph i'm using the same bell curve okay only my diagram is becoming bad okay so this is my bell curve this is my 4 okay this is my 5 this is my 6 this is my 3 this is my 2 this is my 1 here you know that my mean is 4 and standard deviation is 1 ok now understand one thing over here i'll talk about zscore again don't worry now let's apply let's apply z score to every values what will happen if i apply z score to every values what will happen okay what is z score formula x of i minus mu divided by standard deviation okay you know the mean mean is nothing but 4 standard deviation is 1 now if i apply z score to everything initially my distribution was like this 1 2 3 4 5 6 7 okay now this was my distribution initially now after applying z score to this what will be my distribution that will be coming apply apply for 1 first of all so if i apply z score to 1 then what will happen 1 minus 4 divided by 1 this is minus 3 can i say this 1 is getting converted to minus 3 yes 1 is converted to minus 3 okay then if i apply the z to the next element 2 then what is 2 minus 4 my 1 it is nothing but minus 2 so here i am actually getting minus 2 right then if i go and apply the z score to 3 then what will happen z of 3 1 minus 4 sorry 3 minus 4 divided by 1 okay sorry so 3 minus 4 divided by 1 what will happen minus 1 so minus 3 will now get converted to minus 1 then 4 will get converted to 0 then it will get converted to 1 2 3 okay now understand the main magic in this with the help of z score is this not the standard deviation of the same elements that we got over here yes or no guys is this not the standard deviation of this all elements that we got after applying the z score after we applied this initially my data set was like this then i got this this element falls at -3 standard deviation this elements fall at minus 2 standard deviation right so here you can definitely see that i'm able to get the standard deviation right yes now what is happening see over here one beautiful thing that is basically happening i had a distribution which was one two three four five six seven after i applied a z score this got converted to 0 1 sorry minus 3 minus 2 minus 1 0 1 2 3 and probably uh yeah right i got this right now what is this distribution then called anybody guesses any guesses what this was initially a normal distribution a normal distribution or a gaussian distribution after i applied a z score what kind of distribution we are actually getting and what is this basic distribution called as anyone anyone can answer me so this distribution where some people have already told it is called as standard normal distribution standard normal distribution so one of the most important property with respect to standard normal distribution is that your mean is 0 and standard deviation is 1 is this satisfying this property or not it is being satisfied right satisfying this property yes so can i write can i write a random variable x or y will belong to standard normal distribution where specifically your mean will be 0 and standard deviation will be 1 right so i hope you are able to understand this guys now okay so i i need to see if you are able to understand i need to see chris op okay ops should be there right so first time i probably think you are able to understand in this way right so after applying a z score we are able to get into a different distribution which is called a standard normal distribution now the question rises why do we do this why do we do this what is the use of doing this okay what is the use of doing this let's go ahead with one practical application one practical application and we do this in machine learning we do this in most of the algorithms okay we do this with most of the algorithms okay now let's go ahead and try to see the practical application suppose i have a data set let's consider that i am solving a machine learning problem statement i have a data set which is called as okay just a second okay perfect so i have a data set in this particular data set let's say that i have features like age okay i have features like salary i have features like weight suppose in this particular data set i have these three columns okay i have this particular things okay now understand one thing h by what unit we will calculate by years salary we may calculate by rupees or dollar weight we may calculate in kgs understand this units these are these are what these are basically units units of calculation okay units of calculation now whenever i have some values like this like 24 25 26 27 salary maybe 40k 50k 60k 70k something right weight maybe 70 is kgs kgs 55 kg is 45 kgs right now here when you have this kind of data always understand okay now in this data obviously you can see the units are completely different our main target should be that we should try to bring up in a form probably in this particular form where my mean is zero and standard deviation equal to one okay at that point of time i can definitely apply standard normal distribution that basically means i can take up this entire data this entire data and apply z score and convert this into standard normal distribution okay i can convert this into standard normal distribution similarly i can go ahead and take up this particular data set i can apply z score and i can basically convert this into standard normal distribution this process is basically called as standardization okay very super important many people will talk about normalization okay normalization i'll talk about the difference between standardization and normalization whenever we talk about standardization in short internally there is a z-score formula getting applied okay so i hope you are able to understand right everyone i guess everybody is able to understand with respect to standardization guys those whoever are spamming they will be removed from this entire life thing i'll hide the user uh completely example naveen okay so naveen will be moved out now yes he's moved out now now you cannot see naveen message okay focus on teach learning over here okay so standardization is a process where i am basically trying to convert a distribution into standard normal distribution the property is that the mean is 0 and the standard deviation is 1. now let's go ahead towards something called as normalization now what exactly is normalization in standardization whenever we talk about here we are getting converted as mean is equal to 0 and standard deviation equal to 1 okay mean equal to 0 and standard equal to 1 standard deviation equal to 1. now in normalization you have an option you will say that i want to i want to shift this entire values or whatever values that i have between 0 to 1 let's consider like this i want to change all these particular values between 0 to 1 right so in this particular case i may definitely apply normalization okay now how do we do normalization there is a very important formula which is called as min max scala in the mean max scalar you just have to provide 0 to 1 and automatically this kind of normalization will happen and yes i will show you practically also don't worry if i want to probably shift this between minus 1 to plus 1 i can basically apply this okay so normalization gives you a process where you can basically define the lower bound and upper bound and you can convert your data between them okay now very important thing where do we use normalization i hope everybody knows about deep learning in cnn whenever you are doing image training image classification or object detection in this particular case understand every images has a pixels suppose i have a 4 cross 4 image 1 2 3 4 1 2 3 4. each and every pixel ranges between 0 to 255 okay each and every pixels is basically between 0 to 255 okay now 0 to 255 what we do before we start training this can be applied with min max scalar and it gets converted between 0 to 1 where the minimum value 0 is assigned to 0 and the maximum value 255 is converted to 1. okay so when we do this automatically we can apply this kind of min max scalar or normalization in this specific order okay so in this particular case i will definitely not use min max scalar because min max scalar has a different formula i will take each and every pixel divide by 255 divide by 255 that's it so when we do this specific division by divide by 255 all your values will be getting changed between 0 to 1 and this is another type of normalization process okay so i hope everybody is able to understand this okay so till here we have discussed about min max scalar we have discussed about normalization standardization now let's solve one practical example for z score practical example okay recently what match has happened cricket match if everybody knows what i'm talking about what cricket match had happened tell me let's let's discuss about this okay okay so what type of match had actually happened recently cricket match i hope everybody is the fan of let's say that okay recently india versus south africa where india lost it obviously okay now let's consider that if i consider odi series let's say odi series right and every time in last year also odi series happened this year also it happened right let's say that i i'll write down the question everybody open your book and all this will be very very interesting the series average of 2021 was somewhere around let's say 250 okay the standard deviation of the score the standard deviation of the score was somewhere around [Music] 10 and rishab final score final score rishabh final score let's consider that he has actually uh played well i know final score was zero okay let's say that i i'm just taking for an example okay let's say rishabh final score was 17 okay so this was the series information for 2021 let's consider okay cricket yes this is for cricket creek bat and ball lagan okay boy francis says so boring so i'm going to remove him okay because he does not deserve to be in this channel okay so he's also removed okay let's consider that rishab panth basically in the final score he has basically scored 70. let's consider for an example now similarly i have a data for 2020 series okay let's say the series average in 2020 let's say that the series average is a little bit different in 2020 the series average of the team scoring in 2020 was 260. the standard deviation of the score of all the matches ah is 12. okay and then over here probably rishabh rishabh richard i have written okay final score is 75 not 75 let's say his final score is 68. now my question is that my question is very much simple okay my question is that this two data i have compared to both the series both the series in which year rishab punt final score was better so this is the question so just by seeing the specific data what do you think guys which score is better which score is better which score is better whether rishabhan played well in 2021 or whether he played well in 2020 so for checking this obviously many people will say 2020 2021 lot of confusion will be there so we will just try to apply for z score now for the 2021 we will apply the z score so z score will be nothing but it will be x of i minus mu divided by standard deviation we know what is x of i in this particular case x of i is nothing but um x of i is nothing but rishab final score is 70. so 70 minus 250 divided by 10 so what we are getting over here what we are getting over here and similarly for 2020 my z score will be x of i minus mu divided by standard deviation which is nothing but over here 68 minus 250 sorry minus minus 260 divided by 12 okay so first one uh let's go and compute with calculator let's go and compute with the calculator so 70 minus minus 250 divided by 10. so this is okay let me do one thing guys you know this properly this values may not be coming let me change this data a little bit okay let me change this data a little bit okay rishabh1 final i'll say average score not final score so that we change this data a little bit otherwise the data will be very very bad okay rishab month average score let's consider that it is 240 okay and resub 1 for average score is somewhere around 245 okay let's consider like this okay 240 and 245 because i gave one score so that is the reason a huge standard deviation is basically coming okay uh at that point of time i'm just taking average score okay average score of the series guys okay average score of the series rishaban this player's average score of the series okay average score of the series here also i'm writing average scores of the series okay average score of the series okay now let me just make some changes and let me put somewhere over here as 240 so 240 minus average score of the series guys three match three match series arumai shaha okay so 240 minus 250 is nothing but minus 10 divided by 10 so this is minus 1 standard deviation and this data will now change to 245 so 245 this will be minus 15 divided by 2l which is nothing but which is nothing but 15 by 2l which is nothing but minus 1.25 okay clear everybody okay no match in average right so understand along with the not out rule something 240 is the average okay let's consider in that specific way i know the data is not approximately right but i could also instead of rishabhanth average score i could have team team average score okay team average score and probably team played well probably in the last match or the first match like that okay in this series they played well that also you can basically say over here instead of rishabhpath i could write team team average score team team score in final match i messed up with the problem statement because i was just thinking something score final math score like that okay team final score here also i can say team final score this will probably be more problematic team final score now based on this i have always again this is an example guys just think of it the main idea is to teach you something so that you can apply that anywhere okay so here i've got minus 1 okay here i got minus 1 here i got minus 1.25 now see i have seen that the mean is 2 in in 21 20 21 so let me write it down again for you so if in 2021 okay the mean is 250. over here you can see the mean is 250 x of i is nothing but how much uh it is nothing but 240 and the mean is 10. sorry and the standard deviation is 10 okay and the standard deviation is there if i have this information can i draw the bell curve can i draw the bell curve so this is my bell curve the mean is how much 250 standard deviation is 10 basically means this will come as 260 270 280 right this will come as 240 to 30 to 20 right and this is my mean right now where does 240 fall into 240 is falling into minus 1 standard deviation so that basically means 240 will fall here right now in 2020 in 2020 you know that your mean is how much to 60 right your mean is 260 x of i that is your final score is 245 and your standard deviation is nothing but 12 okay now based on this i will definitely be able to create another curve which will have this kind of bell curve and my central element will be 260. since my standard deviation is 12 this will become 272 then it will become 284 then it will become 296. similarly over here it will become 248 then it will become 236 then it will become 224 right so here i have my value over here and what is the standard deviation over here it is 1.25 so 1.2 minus 1.25 is this specific standard deviation right now here you can see the area is little bit less right here the area is little bit more so where do you think india has probably performed well in the final match in the final match whether india performed well in 2020 or in 2021 based on this information this information basically tells many thing about probably the pitch condition whenever we say the standard deviation is less that basically means most of the score was rotating around that much values right right so tell me where probably india may have performed well where probably india may have performed well in 2020 or in 2021 yes yes many people are saying 2021 many people are saying 2020 again why 2020 or 2021 understand guys here the standard deviation is more here the standard deviation is less understand over here obviously the z score value is minus 1 here the z score value is minus 1.25 which is greater which is greater okay so think over it this will be an assignment for you tomorrow i'll ask you which one was better okay just tell me the answer tomorrow okay based on the z score because i try to convert those values with respect to standard deviation okay so just tell me the answer tomorrow this will be an assignment for you but i hope you understood this i hope everybody understood this yes think over it which score is better okay which score is better okay okay now let's go to one more practical example of z score okay now this this example most of the time with respect to statistics will come this may be probably asked in exa in interviews also and this is a very very important and important question okay let's say that uh i will probably take one very good example and show it to you how to be done how you can basically do this and how you can actually run learn it okay so uh one problem statement that i am actually going to give to you is that uh this this problem statement will be quite interesting guys okay so try to do this one example i'll give you then we will try to see let's consider that i have an x random variable i have an x random variable so let's come to the stats interview question that's interview question okay now in the stats interview question let's say that i have a random variable x and let's say that this random variable has this kind of distribution 4 5 6 7 3 2 1 and let's say that i have a bell curve which looks like this okay now i want to know my question is my question is my question is very simple my question is what percentage of scores of scores fall above 4.25 did you understand the question everybody if i answer everything then what research you will do more okay what research you will do more right z score basically gives how much standard deviation away from the mean right okay so have you understood the question or not no right no yes no no yes okay many people are saying yes no yes no okay now let me talk about it okay now understand one thing where does 4.25 fall 4.25 will fall over here so this is basically my mean and 4.25 will fall over here let's consider that it is falling over here okay my question is that what is the these are my scores right let's say that these are my scores two three four five one like this are my scores i need to understand from this distribution from this my entire data set what is the percentage of scores that falls above 4.25 that basically means i am interested in this region i am basically interested in this region i am saying that what is the percentage of the scores that are greater than 4.25 this is my question okay simple question is this and now we'll try to understand how we can use z-score in this okay so everybody knows about z-score formula x of i minus mu divided by standard deviation here my mu is 4 standard deviation is 1 what is my x of i x of is nothing but 4.25 minus 4 divided by 1 this value is 0.25 standard deviation okay 0.25 standard deviation what does this basically mean 4.25 falls 0.25 standard deviation from the mean okay from the mean from the mean it is basically falling to 0.25 standard deviation now i got the standard deviation this is i got with the help of z score but now what is the next very important thing obviously from this we will not be able to understand okay how much what will be the percentage then probably this i have got that it is 0.25 is my standard deviation or a z score my my z score is 0.25 now i need i'm interested in this region okay i mean basically interested in this region so how do i come up with the overall percentage from this particular region okay now understand one thing this is a symmetrical bell curve that basically means the entire area i can basically consider it as one okay i can definitely consider it as one now since i am interested in this region i will say this region as tail okay whenever we talk about tail the region that i'm actually interested in basically i want the value with respect to this one part of the region i'll say it as tail the other part that is the remaining portion i will basically say this as body full from here to here so this will basically be my body okay now understand one very important thing how do i check based on this z score what should be the value or what should be the body curve the area of the body curve i want to find out what is the area of this z scores actually help you to find area of the body curve area of the body curve how do we find out i'll talk about it okay z score will definitely help you to find out the area of the body curve now guys just think over it okay what do you think this percentage may be this black this red region percentage may be what do you think over here three numbers are there let's say that total numbers are seven and when i say three numbers on the right hand side what may be the percentage what may be the percentage just think over it just basically with common sense what what may be the just basic common sense guys if i said 3 by 7 what is 3 by 7 it is it is approximately around 48 to 49 right now can we calculate the same thing with the help of z score the answer is yes i have already seen the z value is 0.25 now let me do one thing let me open something called as z table because i want to find out the area of the curve right so z table if i go and search for it you will be able to see in the first link okay you will be able to see in the first link and over here i'll just go over here now see this is how my curves look like right here with z score i will just use another table because this table does not look right okay so let's consider this table okay so always remember three types of z score we can basically get one is this type which again i'll be discussing one is in this type okay now see this uh left z table and this is the right z table okay just a second i will uh just show you how to make the readings over here um two point two point z is point two five right 0.25 do you see guys over here okay see over here what is my z score from here what is my z score over here 0.25 and remember this z table will be giving me the area of the body curve see a z table shows the area to the right hand side of the curve use these values to find the area between z is equal to 0 and any positive value for area in the left table look at the left tail z table instead okay if you want to find out the area in the left tail search for it guys if you want to find an area in the left tail look at the left tail z table instead in this particular case let me take left z table okay because i want to look at the area of this series guys this is the area right now this area i want to get the answer right if i get the answer of this area i can just subtract 1 minus the left body curve 1 minus the left area right i want to get this particular area everybody is able to understand or should i repeat it tell me just tell me guys whether i should explain once again let me explain once again okay everybody is able to see this okay over here just see when very very important thing the z table shows the area to the right hand side of the curve okay use these values to find the area between 0 and any positive value for area in the left tail look at the left tail z table instead okay so here you can see that i want to see the left l or right tail okay what you want to see okay first of all see that you come to this particular diagram you want to see this part or this part obviously you want to calculate this part right but understand one thing in order to calculate this part if i get the value of this part i can just subtract 1 minus left area right if i subtract 1 minus left area will i not be able to get the right part right otherwise you directly go and see in the right table otherwise directly go and see in the right table okay again i'm showing you here you can see 0.25 0.25 right so 0.25 you will be able to see this much this area will be giving from mean to this standard deviation right table is given don't worry left table is also given see over here left table is also given yeah left table is also given you can also check this this table will be giving you the value between this to this then probably you have to find out this one or subtract 1 minus this area then you will be able to understand it okay now i will go to the left table understand again i am going to repeat guys here clearly it is same given that for area and left table left tail look at the left l z table why i am seeing left tail because if i go over here this is my right tail this is my remaining body left tail can become this part so from the entire body if i subtract 1 minus this i will be able to get this very much simple now how do i check this i'll go over here it has given me the instruction over here for area and left l look at left tail z table instead so if i go and see this is my left z table okay now i will go and find out the z value of point two and point two and five so how much i am getting 0.5987 okay so 0.95987 will be my value of this my area of the body curve will be 0.5987 now in order to find out this i will subtract 1 minus 0.5987 now what is 1 minus 0.985 5987 1 minus 0.5987 this is nothing but 0.4013 right so what is the percentage of scores that fall above 4.25 it is nothing but 40 percentage okay so i hope everybody is able to understand yeah data scientist pro come with your real name i'll show you some examples of okay okay overloaded web fc says why subtracting from one it's very simple no see guys again i am talking about this my question is that this is my mean from this particular curve i want to find out what is the percentage of the distribution then what i can do if i want to find out this curve i can take this whole curve subtract with the left one then i will be getting this one right so that is very much simple right so here you are able to get 40 percent now did you understand how important it is basically to understand z score yes 0.59 is the mean to all the left this entire region from this to this from 0.25 standard deviation to the left part right yes so now did you find out how important this is for the interview questions guys if you are able to explain why not directly taking from the right table understand guys write table is not given no this is not right table this is only given from here to here only here to here yeah here to here only this is given if you want to find out from left table then this is the diagram for this for left z table okay understand one thing very much important okay nilas are saying you cannot take it from right table right table there is no information about it you can see this graph right it is only giving information from here to here in the left table you will be able to get the information of the body of of the area of the body of this particular part okay now akashing says give one practical example i've given you one practical example right okay perfect so this was an example with respect to z score standardization all these things we have probably discussed you want to do one more example you want to do one more example just let me know you want to do one more example guys you want to do one more example now you do it okay so the question is in india okay let's let's do one more example in india the average iq is 100 with a deviation with a standard deviation of 15 what percentage of the population would you expect to have an iq lower than 85 okay guys do this example quickly okay do this example okay let's see this so my z score will be what so first of all let's discuss about this graph so here you can see that this is my graph okay so this particular value is how much the mean is 100 my standard deviation is standard deviation is 50 so 115 130 145 similarly i have 85 70 55 okay so i have all these values over here now with respect to this first of all let's go and compute the z-score how do you compute the z-score the same example that what we have done over here here in this particular case of 4.25 falls over we are just taking iq lower than 85 okay so what is iq lower than 85 so it will become 85 minus 100 divided by divided by 50 what it is minus 15 by 15 it is minus 1 so 1 standard deviation this is my mean this is my minus 1 standard deviation now this is the area that i want to find out now when i want to find out this particular area this area is already the body part the left of the curve right so what i will do i will just go and compute for minus 1 now if i want for minus 1 what it is go and compute it over here how much it is 1.0 so this is 0.86 let me just compare the answers do it guys 15.87 probably are doing some mistakes see the thing is that you are not right now watching the exact z table correctly now let me just select some different z table so that you will get an idea i'm actually not able to find the right z table yeah this looks good yeah so i will give you the link 0.84 so what i'm actually getting 0.84134 right is everybody able to see this is everybody able to see this 0.84134 right this is plus 1 understand this is plus 1 right plus 1 when i say understand over here plus 1 when i say it is basically from this region to this region okay now if i subtract 1 minus point eight 0.8414 one three four that will basically be my values right clear everybody lower than 85 understand lower than 85 lower okay you may also get an question iq between 90 to 120 like this question also you may get for the same problem statement right so you may get questions like this at that point of time again you have to solve it in a different way but here is just an idea to talk about what is body area of the body okay everybody clear i know if you are not unable to understand it please revise guys because we have limited time i still need to cover many many topics i thought of doing some programming also with you yeah negative will not matter if you say negative it will come from here if you say sorry if you can say negative it will come from here if you say positive it will come from here understand both the side are symmetric minus 1 also you can look that only i'm saying no in the table whatever you are able to find out you can definitely check out minus 1 also from top minus 1.0 same thing you'll be getting right minus one point two zero is one point one five eight eight six which is one minus point eight four right same thing okay now let me do one thing guys quickly show you google collab pro so that we can have some programming sessions uh quickly let's complete some simple simple things i know if you are getting tired just imagine how much diet i may be getting so let's not break the flow and probably learn a lot okay okay now quickly start answering me how to do with python okay so first of all i'm going to import some libraries as this import numpy as np import connect it import matplotlib dot pi plot as plt okay and then probably i will say matlab lab inline so all these things we are actually done now guys i have seen the right z table this is only the z table score right see for 1.0 i got how much for one point zero i got point eight four one three four if i subtract one minus point eight four one three four i'll be getting the same thing over here point one five eight six six okay so here it is and then probably i'll also import statistics okay now first thing first how to compute mean mean median mode okay we are going to see that first of all let me load a data set which is called as i'll load a data set which is called as tips okay and this will basically be giving me df is equal to this one okay then i'll say df.head okay so here you can see this is my entire data set now quickly if you want to see how to do mean for this let's say that i'm using np dot mean function for finding the total bill mean total below mean okay so if i execute this you will be able to see the answer so this is the what is the mean of the total bill okay if i want to probably find out the median also you will be able to find out median mp.median df of total bill right so here you will be able to see np dot median okay so over here you see some differences if you are seeing some differences think that there may be something like you know some kind of outliers also okay if you want to try for mode i can use statistics dot mode and again i will be using df of total underscore bill so here you go this is got mode is nothing but 13.42 okay now the thing is that if i want to go and see my box plot which is basically used to see outliers so if i use df of total bill total underscore bill so here you will be able to see my box plot also so this is one example of box plot so does this indicate it has an outlier okay now definitely over here outlines is present but what is this this is 25 sorry minimum 25 percentile median 75 percentile and max okay so all these things we have calculated if you write df of sns dot there is something called as list plot which will basically help you to create histograms on a specific feature so if i execute this you will be able to see one example which looks like this is this a normal distributed data is this a normal distributed data i guess no if you want to see with the probability density function i'll be using k d e is equal to true so with k d is equal to true does this look like a normally distributed no it is like little bit skewed towards the right i'll also show you some examples with respect to uh normally distributed data so for that i will do sns.load underscore data set i will be using iris data set iris flower data set basically is the data set which will actually help you to give a data of a different types of flowers with respect to iris so here you will be able to see that df1 dot head okay so here you have flowers like setosa oversee color and here you have four features sepal lens sepal width petal and then petal bit now let's see i will just try to plot the same thing with one of the feature okay let's say that i am doing it with sepal length underscore length is the spelling wrong oh df1 so here you can see that does this follow a gaussian distribution does this follow a gaussian distribution no i guess let's try with sepal width finally we'll be able to see something wow this follows a gaussian distribution everyone guys you have to do it in google collab not collab pro okay you do it in google collab because collab pro takes a subscription charges for 10 dollars per month definitely we can definitely say for this this is a gaussian distribution yes so this is specifically a gaussian distribution over here okay and here you can also apply that rule that is 68 95 99.7 percentage rule so all these things you can basically check out over here and you are getting this i'll also show you how to construct this pdf function at all as we go ahead okay it is normally distributed definitely we can say that it is normally distributed okay so this was one example with respect to normally distributed this is not normally distributed you know sns dot count plot of dfo if i use count plot with respect to species species spelling is wrong okay df1 again i'm writing df what is this plot guys what is this plot this is our bar graph right this is our bar graph right this is our bar graph bar plot or bar graph whatever you want then i'll stop okay one last thing should we do ba outliers how to do outliers in through code okay percentiles let's do for percentile so for percentile i can use np dot and i can use my df of let me do one thing let me open one example that i had written for you and probably will complete this and uh do it if you do this much i think it will be sufficient for today okay let me just show it to you i will finish it off today no tomorrow there will be a new topic that will coming you know if you want to complete quickly you just hit like make a thousand subscribers otherwise not stop the class how is this a good day so i will basically use over here like this let's say i'm going to use sepal len and here i can basically give some parameters like let's say that i want to get the 25 percentile and 75 percent okay so if i execute it here separate here is a df1 what is this hell okay why i'm making this mistake so here you can see that i'm getting 5.1 as the 25 percentile and 64 75 percentile is 6.4 so my iqr will be 6.4 minus 5.1 okay if you want to probably get the 99 percentile also you can basically write like this 99 so here you will be able to get the value 5.1 and 7.7 right okay so i can understand people problem let's do the outlier formulation through code tomorrow okay uh all this course materials will be added uh in the community session please try to join the community session below or why guys how many of you have taken one neuron please go ahead and take it guys right now it is for lifetime you can raise any course request you can do anything you can you can kill us for that you know you can throw bomb at us whatever you want you do okay but please make sure that you take one neuron there you are probably able to get hundred plus courses for lifetime okay and probably in just a month you will be able to see more 20 30 courses getting added every day every sorry every month okay so please go ahead take up there is also a discount coupon on my name [Music] so please do that i have also taught starts in eye neuron binomial bernoulli it took time no finishing off tomorrow we'll discuss that okay ds road map has already been put up guys so in the one neuron platform so please go ahead take it yeah achachi is there for 7000 plus 7080 rupees maybe 10 discount you are getting courses for lifetime so tell your friends guys do it what is the coupon coupon is chris 10 check out the description of this particular video every information is given okay you can raise any demand i'll give you some funny demands that was raised sir upload german language i need to learn german so upload french language i need to learn french this kind of things are there try to raise technical questions okay i use i don't know the last date because we are making the platform matured enough we may close see once we achieve our target probably and within some time when more than 200 300 courses gets uploaded because right now it is maturing we are updating more and more more and more content right so it is important okay so please go ahead and take it okay and yes this was it from my side why you removed your stats from beginner free course from dashboard because i have uploaded the course no full re-recorded entire course is actually present go and search for stats you will be able to see ritesh okay so thank you guys uh this was it uh go ahead take up one year on course support us tell all your friends we are doing some great work and probably will keep on doing it okay thank you everyone see you tomorrow in tomorrow's session we are going to see a lot of things okay thank you guys have a great day bye bye mongodb also is include getting included okay mongodb is also getting included don't worry
Original Description
Join the community session https://ineuron.ai/course/Mega-Project-Foundation . Here All the materials will be uploaded.
The Oneneuron Lifetime subscription has been extended.
In Oneneuron platform you will be able to get 100+ courses(Monthly atleast 20 courses will be added based on your demand)
Features of the course
1. You can raise any course demand.(Fulfilled within 45-60 days)
2. You can access innovation lab from ineuron.
3. You can use our incubation based on your ideas
4. Live session coming soon(Mostly till Feb)
Use Coupon code KRISH10 for addition 10% discount.
And Many More.....
Enroll Now
OneNeuron Link: https://one-neuron.ineuron.ai/
Direct call to our Team incase of any queries
8788503778
6260726925
9538303385
866003424
Watch on YouTube ↗
(saves to browser)
Sign in to unlock AI tutor explanation · ⚡30
Playlist
Uploads from Krish Naik · Krish Naik · 0 of 60
← Previous
Next →
1
 2
2
 3
3
 4
4
 5
5
 6
6
 7
7
 8
8
 9
9
 10
10
 11
11
 12
12
 13
13
 14
14
 15
15
 16
16
 17
17
 18
18
 19
19
 20
20
 21
21
 22
22
 23
23
 24
24
 25
25
 26
26
 27
27
 28
28
 29
29
 30
30
 31
31
 32
32
 33
33
 34
34
 35
35
 36
36
 37
37
 38
38
 39
39
 40
40
 41
41
 42
42
 43
43
 44
44
 45
45
 46
46
 47
47
 48
48
 49
49
 50
50
 51
51
 52
52
 53
53
 54
54
 55
55
 56
56
 57
57
 58
58
 59
59
 60
60

Natural Language Processing|Stemming
Krish Naik
Natural Language Processing|BagofWords
Krish Naik
Gaussian distribution or Normal Distribution in statisctics
Krish Naik
Natural Language Processing|TF-IDF for Machine Learning| Text Prerocessing
Krish Naik
Log Normal Distribution in Statistics
Krish Naik
Covariance in Statistics
Krish Naik
Confusion matrix, Precision, Recall| Data Science Interview questions
Krish Naik
Tutorial 44-Balanced vs Imbalanced Dataset and how to handle Imbalanced Dataset
Krish Naik
Implementing a Spam classifier in python| Natural Language Processing
Krish Naik
Tutorial 11-Exploratory Data Analysis(EDA) of Titanic dataset
Krish Naik
Face Recognition using open CV and VGG 16 Transfer Learning
Krish Naik
Pedestrian Detection using OpenCV from Videos
Krish Naik
Face and Eye Detection from Videos using HAAR Cascade Classifier
Krish Naik
Reading, Writing and Displaying images with Opencv| OpenCV Tutorial
Krish Naik
OpenCV Installation | OpenCV tutorial
Krish Naik
Face and Eye Detection from Images using HAAR Cascade Classifier
Krish Naik
Car Detection using HAAR Cascade and Opencv from Videos.
Krish Naik
Using OpenFace for Face recognition in Keras
Krish Naik
OpenPose Tutorial with Tensorflow
Krish Naik
Multiple Linear Regression using python and sklearn
Krish Naik
Dimensional Reduction| Principal Component Analysis
Krish Naik
Movie Recommender System using Python
Krish Naik
TPR,FPR,FNR,TNR, Confusion Matrix
Krish Naik
Precision, Recall and F1-Score
Krish Naik
Artificial Neural Network for Customer's Exit Prediction from Bank
Krish Naik
GridSearchCV- Select the best hyperparameter for any Classification Model
Krish Naik
RandomizedSearchCV- Select the best hyperparameter for any Classification Model
Krish Naik
K Nearest Neighbor classification with Intuition and practical solution
Krish Naik
K Means Clustering Intuition
Krish Naik
Create custom Alexa Skill- Lambda function- Part2
Krish Naik
Hierarchical Clustering intuition
Krish Naik
Implement Transfer Learning with a generic Code Template
Krish Naik
Gender Classifier and Age Estimator using Resnet Convolution Neural Network
Krish Naik
Unlock Your Application With Your Face using OpenCV
Krish Naik
Draw rectangle from webcam and sketch process it on a live feed
Krish Naik
Complete Life Cycle of a Data Science Project
Krish Naik
How we can apply Machine Learning in Finance
Krish Naik
Deep Learning in Medical Science
Krish Naik
How to switch your career to Data Science.
Krish Naik
Linear Regression Mathematical Intuition
Krish Naik
Handle Categorical features using Python
Krish Naik
Machine Learning Algorithm- Which one to choose for your Problem?
Krish Naik
DBSCAN Clustering Easily Explained with Implementation
Krish Naik
Curse of Dimensionality Easily explained| Machine Learning
Krish Naik
Feature Selection Techniques Easily Explained | Machine Learning
Krish Naik
Tutorial 29-R square and Adjusted R square Clearly Explained| Machine Learning
Krish Naik
Cross Validation using sklearn and python | Machine Learning
Krish Naik
Handling Missing Data Easily Explained| Machine Learning
Krish Naik
Deploy Machine Learning Model using Flask
Krish Naik
Deployment of Deep Learning Model using Flask
Krish Naik
How to Visualize Multiple Linear Regression in python
Krish Naik
K Nearest Neighbour Easily Explained with Implementation
Krish Naik
Predicting Heart Disease using Machine Learning
Krish Naik
Predicting Lungs Disease using Deep Learning
Krish Naik
Stock Sentiment Analysis using News Headlines
Krish Naik
Random Forest(Bootstrap Aggregation) Easily Explained
Krish Naik
Voting Classifier(Hard Voting and Soft Voting Classifier)
Krish Naik
Credit Card Fraud Detection using Machine Learning from Kaggle
Krish Naik
Hyperparameter Optimization for Xgboost
Krish Naik
Tutorial 45-Handling imbalanced Dataset using python- Part 1
Krish Naik
More on: ML Maths Basics
View skill →






Related Reads
📰
📰
📰
📰
GossipGraD: Scalable Deep Learning using Gossip Communication based AsynchronousGradient Descent
Dev.to AI
9 Python Insights Every ML Engineer Gains Over Time
Medium · AI
9 Python Insights Every ML Engineer Gains Over Time
Medium · Data Science
Data Quality: The Most Underrated Factor in AI Success
Medium · Machine Learning
🎓
Tutor Explanation

 DeepCamp AI