Flat and Hierarchical Clustering | The Dendrogram Explained
Key Takeaways
The video covers flat and hierarchical clustering, introducing the dendrogram as a visualization tool for understanding cluster linkages, and discusses the pros and cons of hierarchical clustering.
Full Transcript
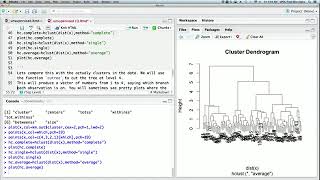
hi and welcome we at 365 data science specialize in data science trainings we post videos weekly so you can master indispensable skills for free alright let's get started we will have a short lecture about clustering of clustering originally cluster analysis was developed by anthropologists aiming to explain the origin of human beings later it was adopted by psychology intelligence and other areas nowadays there are two broad types of clustering flat and hierarchical k-means is a flat method in the sense that there is no hierarchy but rather we choose the number of clusters and the magic happens the other type is hierarchical and that's what we are going to discuss in this lecture historically hierarchical clustering was developed first so it makes sense to get acquainted with it an example of clustering with hierarchy is taxonomy of the animal kingdom for instance there is the general term animal sub clusters are fish mammals and birds for instance there are birds which can fly and those that can't we can continue in this way until we reach dogs and cats even then we can divide dogs and cats into different breeds moreover some breeds have sub breeds this is called hierarchy of clusters there are two types of hierarchical clustering agglomerative or bottom-up and divisive or top down with divisive clustering we start from a situation where all observations are in the same cluster like the dinosaurs then we split this big cluster into two smaller ones then we continue with three four five and so on until each observation is its separate cluster however in order to find the best split we must explore all possibilities at each step therefore faster methods have been developed such as k-means with k-means we can simulate this divisive technique when it comes to agglomerate of clustering the approach is bottom-up we start from different dog and cat breeds cluster them into dogs and cats respectively and then we continue pairing up species until we reach the animal cluster agglomerative and divisive clustering should reach similar results but agglomerative is much easier to solve mathematically this is also the other clustering method we will explore agglomerative hierarchical clustering in order to perform agglomerative hierarchical clustering we start with each case being its own cluster there is a total of n clusters second using some similarity measure like euclidean distance we group the two closest clusters together reaching an N minus 1 cluster solution then we repeat this procedure until all observations are in a single cluster the end result looks like this animal kingdom representation the name for this type of graph is a dendrogram a line starts from each observation then the two closest clusters are combined then another two and so on until we are left with a single cluster note that all cluster solutions are nested inside the dendrogram all right let's explore a dendrogram and see how it works here is the dendrogram created on our country cluster data okay so each line starts from a cluster you can see the names of the countries at the beginning of those lines this is to show that at the start each country is a separate cluster the first two lines that merge are those of Germany and France according to the dendrogram these two countries are the closest in terms of the features considered at this point there are five clusters Germany and France are one and each country is its own cluster from this point on going up Germany and France will be considered one cluster now here's where it becomes interesting the next two lines that merge are those of the Germany and France cluster and the UK at this point there are four clusters Germany France and the UK are one and the rest are single observation clusters at the next stage of the hierarchy Canada and the US joined forces next step is to unite the Germany France UK cluster with the canada-us one Australia is still alone finally all countries become one big cluster representing the whole sample okay cool what other information can we get from the dendrogram well the bigger the distance between two links the bigger the difference in terms of the chosen features as you can see Germany France and the UK merged into one cluster very quickly this shows us that they are very similar in terms of longitude and latitude moreover Germany and France are closer than Germany in UK or France and UK the USA in Canada came together not long after however it took half of the dendrogram to join these five countries together this indicates the Europe cluster and the North America cluster are not so alike finally the distance needed for Australia to join the other five countries was the other half of the dendrogram meaning it is extremely different from them some up the distance between the links shows similarity or better dissimilarity between features all right next on our list is the choice of number of clusters if we draw a straight line piercing these two links we will be left with two clusters right Australia and one and all the rest in the other instead if we Pierce them here we will get three clusters North America Europe and Australia the general rule is when you draw a straight line you should count the number of links that have been broken in this case we have broken three links so we will be left with three clusters because the links were coming out of those three clusters should we break the links here there will be four clusters and so on great finally how should we decide where to draw the line well there is no specific rule but after solving several problems you kind of develop an intuition when the distance between two stages is too big it is probably a good idea to stop there for our case I would draw the line at 3 clusters and remain with North America Europe and Australia okay when most people get acquainted with dendrograms they like them a lot and I presume that is the case with you - lets see some pros and cons the biggest Pro is that hierarchical clustering shows all the possible linkages between clusters this helps us understand the data much much better moreover we don't need to preset the number of clusters we just observe the dendrogram and take a decision another Pro is that there are many different methods to perform hierarchical clustering the most famous of which is the ward method different data behaves in different ways so it is a nice option to be able to choose the method that works better for you k-means is a one size fits at all method so you don't have that luxury how about a con the biggest con which is also one of the reasons why hierarchical clustering is far from amazing is scalability I will just show you a single dendrogram of 1,000 observations and you will know what I mean 1,000 observations and the dendrogram is extremely hard to be examined you know what else it is extremely computationally expensive the more observations there are the slower it gets while k-means hardly has this issue thanks for watching if you found this video interesting and want to gain an edge in your career make sure to LIKE comment and subscribe and don't forget to check out some of our other videos for another quick win in the data science skills department
Original Description
👉🏻 Download Our Free Data Science Career Guide: https://bit.ly/3h1BDyg
👉🏻 Sign up for Our Complete Data Science Training with 57% OFF: https://bit.ly/3g0esTA
In this tutorial, we introduce the two major types of clustering: Flat and Hierarchical. Then we explain the Dendrogram, a visualization of hierarchical clustering.
► Consider hitting the SUBSCRIBE button if you LIKE the content: https://www.youtube.com/c/365DataScience?sub_confirmation=1
► VISIT our website: https://bit.ly/365ds
🤝 Connect with us LinkedIn: https://www.linkedin.com/company/365datascience/
365 Data Science is an online educational career website that offers the incredible opportunity to find your way into the data science world no matter your previous knowledge and experience. We have prepared numerous courses that suit the needs of aspiring BI analysts, Data analysts and Data scientists.
We at 365 Data Science are committed educators who believe that curiosity should not be hindered by inability to access good learning resources. This is why we focus all our efforts on creating high-quality educational content which anyone can access online.
Check out our Data Science Career guides: https://www.youtube.com/playlist?list=PLaFfQroTgZnyQFq4nUfb-w2vEopN3ULMb
#flat #hierarchical #clustering
Watch on YouTube ↗
(saves to browser)
Sign in to unlock AI tutor explanation · ⚡30
Playlist
Uploads from 365 Data Science · 365 Data Science · 0 of 60
← Previous
Next →
1
 2
2
 3
3
 4
4
 5
5
 6
6
 7
7
 8
8
 9
9
 10
10
 11
11
 12
12
 13
13
![INDEX and MATCH application of the two functions separately and combined [Advanced Excel]](https://i.ytimg.com/vi/9vrIFfMdYng/mqdefault.jpg) 14
14
![INDIRECT Excel Function: How it works and when to use it [Advanced Excel]](https://i.ytimg.com/vi/kDkS8rNCoBM/mqdefault.jpg) 15
15
![VLOOKUP and MATCH another useful functions combination [Advanced Excel]](https://i.ytimg.com/vi/2435x9FV6qY/mqdefault.jpg) 16
16
![VLOOKUP COLUMN and ROW - Handle large data tables with ease [Advanced Excel]](https://i.ytimg.com/vi/ToUaAqevy9E/mqdefault.jpg) 17
17
![The ELIF keyword [Python Fundamentals]](https://i.ytimg.com/vi/h3Vi9mtw2Jo/mqdefault.jpg) 18
18
 19
19
 20
20
 21
21
 22
22
 23
23
 24
24
 25
25
 26
26
 27
27
 28
28
 29
29
 30
30
 31
31
 32
32
 33
33
 34
34
 35
35
 36
36
 37
37
 38
38
 39
39
 40
40
 41
41
 42
42
 43
43
 44
44
 45
45
 46
46
 47
47
 48
48
 49
49
 50
50
 51
51
 52
52
 53
53
 54
54
 55
55
 56
56
 57
57
 58
58
 59
59
 60
60

Population vs Sample
365 Data Science
Data Science & Statistics: Levels of measurement
365 Data Science
Statistics Tutorials: Mean, median and mode
365 Data Science
Skewness
365 Data Science
What is a distribution?
365 Data Science
The Normal Distribution
365 Data Science
Central limit theorem
365 Data Science
Student's T Distribution
365 Data Science
Type I error vs Type II error
365 Data Science
Hypothesis testing. Null vs alternative
365 Data Science
The linear regression model
365 Data Science
Simple linear regression model. Geometrical representation
365 Data Science
INDEX and MATCH application of the two functions separately and combined [Advanced Excel]
365 Data Science
INDIRECT Excel Function: How it works and when to use it [Advanced Excel]
365 Data Science
VLOOKUP and MATCH another useful functions combination [Advanced Excel]
365 Data Science
VLOOKUP COLUMN and ROW - Handle large data tables with ease [Advanced Excel]
365 Data Science
The ELIF keyword [Python Fundamentals]
365 Data Science
Working with Tuples in Python
365 Data Science
Database Terminology - A Beginners Guide
365 Data Science
Relational Database Essentials
365 Data Science
Database vs Spreadsheet - Advantages and Disadvantages
365 Data Science
Conditional Statements and Loops
365 Data Science
Backpropagation – The Math Behind Optimization
365 Data Science
Monte Carlo: Forecasting Stock Prices Part I
365 Data Science
Monte Carlo: Forecasting Stock Prices Part II
365 Data Science
Monte Carlo: Forecasting Stock Prices Part III
365 Data Science
365 Data Science Online Program
365 Data Science
Data frames - Creating a data frame
365 Data Science
Data Science & Statistics: Slicing a matrix in R
365 Data Science
Data frames in R - Exporting data in R
365 Data Science
Data frames in R - Transforming data PART II
365 Data Science
Data Frames in R - Subsetting a data frame
365 Data Science
Data Science & Statistics: Matrix arithmetic in R
365 Data Science
Data Science & Statistics: Indexing an element from a matrix
365 Data Science
Data Frames in R - Extending a data frame
365 Data Science
Data Science & Statistics: Creating a matrix in R FASTER
365 Data Science
Data Science & Statistics: Creating a Matrix in R
365 Data Science
Data frames - Importing data in R
365 Data Science
Data frames in R - Getting a sense of your data
365 Data Science
Data frames in R - Transforming data PART I
365 Data Science
Data frames in R - Import a CSV in R
365 Data Science
Data Science & Statistics: Matrix operations in R
365 Data Science
Data Science & Statistics: Matrix recycling in R
365 Data Science
Tableau vs Excel: When to use Tableau and when to use Excel
365 Data Science
Download Tableau: Learn how to download Tableau Public
365 Data Science
Connecting data sources: Useful tips when connecting data sources to Tableau
365 Data Science
The Tableau interface: See how to navigate through the Tableau interface
365 Data Science
Tableau data visualization: Create your first Tableau visualization!
365 Data Science
Duplicating sheets: This is how to duplicate a sheet in Tableau
365 Data Science
Build a table in Tableau: The steps needed to create a simple table in Tableau
365 Data Science
Custom fields in Tableau: Using Tableau operators to create custom fields
365 Data Science
Custom fields in Tableau: Add calculations to tables through custom fields
365 Data Science
Totals in Tableau: Learn how to display subtotals and totals in Tableau
365 Data Science
Gross Margin calculation in Tableau
365 Data Science
What is a filter in Tableau: Set up a filter in Tableau to specify the data you want to show
365 Data Science
Joins in Tableau: Inner, outer, left, or a right join in Tableau
365 Data Science
Building a Tableau dashboard: Three types of charts you want to have in a Tableau dashboard
365 Data Science
Creating great looking charts in Tableau: Real life Exercise on charts in Tableau
365 Data Science
Joins in Tableau: Choose the correct join type
365 Data Science
How to make a data check in Tableau: A quick data check is better than no data check
365 Data Science
More on: Unsupervised Learning
View skill →





Related Reads
📰
📰
📰
📰
How to build a faceless YouTube channel with AI in 30 days
Dev.to AI
What Is Cognitive Training? A Beginner's Guide for Adults
Dev.to AI
Bukan Menggantikan, Ini Cara Memanfaatkan AI Terkini untuk Naikin Produktivitas Kerjamu
Medium · AI
Rytr vs QuillBot for Academic Writing 2026: Which AI Tool Actually Saves Your Thesis?
Dev.to AI
🎓
Tutor Explanation

 DeepCamp AI