Episode 4: Simple and Basic Binary Classification Metrics
Key Takeaways
This video covers the basics of binary classification metrics, including accuracy, precision, recall, F1 score, AUC, and log loss, using scikit-learn in Python to implement these metrics in a custom ML framework.
Full Transcript
hello everyone and welcome to another episode of my applied machine learning series in this episode I'm going to talk about binary classification metrics and then we are going to implement them in our machine learning framework that we are building so to start with in binary classification I mean there are many metrics but most important ones are so you have binary classification and the metrics so one of the simplest metric to start with is accuracy and then we have precision recall f1 score or just f1 and we have a you see which is also known as area under the ROC curve where Rawkus receiver operating characteristics okay great so to understand these metrics more now I'm missing one and block loss quite important so to understand these metrics more we first have to know about a few terms so we have true positives TP true positives are your predictions where so remember we are dealing with binary classification problem so everything is in 0 and 1 this is negative and this is positive so true positives are if the target in the test set is positive and you have predicted positive then it's a true positive similarly we have true negatives tn and that's if the original target is zero or negative and you have predicted negative then it's a true negative then you have false positives FB and those are when the target original target value is negative or zero and you have predicted positive or one then it's a false positive and similarly we have false negatives FN so when the true value is one and you're predicting zero it becomes so false negative so what would accuracy be now put it like a very simple way accuracy is nothing but the correct predictions divided by total number of samples so correct predictions divided by total samples and if we have to write this in terms of false positives and true negatives what-what would be so you have true positive plus true negatives divided by true positive plus true negative plus false positive Plus false negative and you have to remember that this is all samples always then we move to precision precision says how precise your model lives as the name say so precision is defined as true positive / true positive plus false positive so when your precision is higher it means that your false positive rate or FBR this is lower so you're predicting less amount of false positives which is what we want to do when we build a good model then you have recall and recall is true positive / true positive plus false negative so you recall should be higher than 0.5 and if it's towards 1 it's very good so all of these are between 0 & 1 0 is bad one is good so the next one that we are looking at is f1 score or simply F 1 and F 1 is nothing but a weighted average kind of about for recall and precision so it can it can be defined as 2 times recall precision divided by recall plus precision and in terms of our notations of true positives and false positive and so on it can also be expressed as 2 times true positive / two times through positive plus false positive plus false negative so if you look at these two equations here and here you can combine them both and you get this so that's just very simple math to do so what's next is another interesting metric which is used very often and that's called AUC and I've seen like sometimes it's very difficult to understand what AUC is so to understand AUC we define two new terms TPR or true positive rate so what is true positive rate true positive rate is defined as true positive / true positive plus false negatives and if you're following then you have already seen this one so this equation here for TP are the same as recall so TP r is also known as recolor vice versa and FP r which is the false positive rate or false positive rate so FP r is defined as false positive divided by true negative plus false positive so once we have these two terms we can look into you see and understand what AUC is so before that let's imagine you have some real target variables like zero zero one zero one one and you made some predictions 0.6 0.4 0.7 0.3 0.5 0.9 so these are your true values and these are your predictions probabilities predictions which are probabilities of any sample being one so we predict with 0.6 probability or 60% probability that this is 1 which is wrong in this case but yeah so what is a you see actually you see is nothing but a graph between TPR and FBR now you're wondering how we can calculate TPR and FBR from these predicted values that we have so what we do is we calculate t PR + f PR and we create a table and threshold so we calculate at zero threshold 0.1 0.2 0.3 and we can build a graph like this so your minimum value can be 0 and maximum can be 1.0 so here I have shown a step of 0.1 but it's calculated at each step and once you have this plot between T P R and F here you calculate the area under this curve and this area under curve is known as a you see that's it quite a simple explanation I would say so you've got some values for each and then you just plot a you see of one point zero implies a very good model and a you see of zero bad model and the easy of 0.5 is a random model so if you have these values and you randomly predicted a list of values between 0 & 1 ABC will be near to 0.5 or 0.5 or if you predict 0.5 for all a you see will be 0.5 so when we have a data set with binary classification so let's say this is my target and these are my different samples and these are the features that I have samples 0 1 0 0 1 so let's say these are my targets so when you calculate a UC which will be a number between 0 & 1 you see it always between zero and one what is it actually what does the number represent the number represents given any any sample from this data set any positive sample from this data set and given any negative sample from this data set any randomly chosen negative sample any randomly chosen positive sample what is the probability that this positive sample will rank higher than this negative sample and that value is represented by a you see so one more thing about AUC is you don't need to use probabilities all the time so it can be any real number you just need to choose proper cut off and draw make the plot and then you're done the next metric is log loss so how do we define log loss log loss is defined as true log of let's use something else so why log of prediction plus 1 minus y log of 1 minus friction this is the definition of log loss and log locks is being used quite a lot in binary classification multi-class multi-label classification problems and one thing that you should note here this value that you're going to get it's going to be negative so it's x -1 + log loss penalizes quite high when you make a wrong prediction so if your classes a 0 & 1 and you have zero point one and zero point nine that's okay but if you have zero point 1 and sort of point six the penalization is going to be much higher because the loss is much higher so that's something you have to note and this equation represents log loss for one sample so log loss for all the samples would be just an average so now let's look at some code we are not going to implement anything from scratch we are going to use scikit-learn and we're going to plug in some metrics from scikit-learn to our ml framework to start with coding let's see what we have till now we have do we have metrics okay so we have file named metrics of Pi in the framework and what we are going to do is we are going to create a class again classification metrics so I'm naming it classification metrics because we are also going to expand it to multi level and multi class later we will also see that some of the metrics that are already in scikit-learn they work with multi level or multi class some of them so we don't need to implement anything so you need a init function self and let's say which metrics we want to implement so we will just implement the five that we already saw and let's look at this function later so the first metric that we saw was accuracy so what I'm going to do is I'm going to create a function inside this class called underscore accuracy and then we let scikit-learn do its job but we need some variables Y true argument and wipe red so true labels and predicted labels and then what we do is we just return let's import metrics from cyclone from SK learn import metrics as ski metrics return s key metrics by true equal to y true my thread equal to Y thread okay so we have a function that's not using so it should be SK metric start accuracy score we have a function that doesn't doesn't use anything from the class itself so we define it as a static method so it's not using self and here we say ok what matrix do we have matrix equals dictionary and you made your first matrix accuracy self dot underscore accuracy that's all you have let's let's let's remove the comma for now but how do you how do you call this class so we define a call function self comma metric comma Y true comma Y friend let's call it Y test oh maybe just by true it's okay white bread so you're you have a metric which is the name of a metric which is accuracy right now you have white Roux which are the true predictions and white bread which are the predictions that you made and currently we are only looking at binary classification so everything is binary for now then you need to check if this matrix if metric not and self dot metrics is an exception metric not of the rentals or you can also raise a not implemented error now since we have accuracy but we will be having more metric so what I'm going to do is I'm going to say okay self dot metrics metric name and why true go to why true and wipe read the culture wipe read okay so we just return this so this gives us classification metrics accuracy score for binary classification actually it also works for multi-class classification because you have you're using accuracy from scikit-learn and now to test this let's see we go to source directory and we say ok import from metrics and poor classification metrics and let's say your true labels are 0 0 1 0 1 1 and your predicted labels are 0 1 0 0 1 0 then you do okay classification matrix just calling classification matrix and I have only implemented accuracy and true and predicted so this just didn't work let me see why so yeah I forgot to bracket so when you add to bracket it works so you got 0.5 let's make it a little bit better so 0.666 so this works we implement an accuracy score and that's actually using scikit-learn and we can do the same for other metrics that we have discussed so we can do that static method and define f1y true my scope read and then you I'm just going to copy paste this you have a sort of accuracy score you have f1 score and similarly you have underscore recall choose recall score and similarly you have precision which is your precision score and now we want to add them here so we want f1 of score f1 precision recall star in the sky recall okay so yeah quite easy stuff yeah it's it's because we are using everything from scikit-learn which is an awesome library but since we're so one question might arise then why are we even doing this everything is inside so I could learn it's because we were building our own framework and we want to make it a little bit more general so that whenever we have to use any kind of metric we just get it from classification metric instead of scikit-learn and we don't we also don't want all the metrics we don't want to use all the metrics all the time so one more thing now is implementing a UC so we haven't made the function yet so let's make the function first so I can just copy this and put it here and this will be my a you see you see score sorry ROC AOC score okay now the problem with this is a UC expects probabilities if you don't provide probabilities it's going to give you a very bad score unless your model is hundred percent correct so why we need why Provo and we say this can be none so we need to add a condition here now if metric equals to e you see if Y or we can just add it here and y prova is not none let's add it let's not add it here if metric is a you see if y prova is not none then you return self dot you see why true will be y true and why Bret is why prover else you return you raise an exception saying why proba cannot be done for a UC else you return this okay that's great so let's see if this works like to the same thing again classification matrix and I have the true samples I have two predicted samples and now I just calculate a UC so it cannot be none so I think for a UC it's known as Y prova Y true why score okay they have changed it okay so that's fine so where is my a you see from my score is the swipe right we are keeping everything white-bread see this is also an advantage of doing this so I got the classification matrix true samples British samples and now I have the AUC but what i'm doing here is instead of the predictions prediction probabilities I'm just giving it to frictions but I can also give it probabilities so let's try 0.5 0.5 0.5 second 5 2 point 5 so 5 and your AC is 0.5 so when you have random predictions are all 1 5 you see is going to be 0.5 which means it's random all so they use increases because that actual value was 1 yeah one more reason that we need this special class is because we might want to we might not want to import all the libraries all the time but just import this function this script matrix and this class classification matrix and you can have metrics from other libraries too so from I don't know some library import cool metric and that that's your cool classification metric and you can create a function for that underscore cool metric and then do the same thing return cool metric and something something something else like this and one more reason to do this is if if you want to implement your own metric so if I want to implement my own metric I have that's the same thing and here I can just implement the metric as I want a present of metric as you like and then return the results so this is one of the reasons so I want flexibility I want just one class I can import any metric from that class I can calculate any metric I can calculate multiple metrics at the same time and this is going to be quite useful the next thing that we are missing here long loss so you can implement La Crosse on your own it's quite easy to do that or you can just use it from scikit-learn like I like to do so log loss will be self dot underscore bluglass and just gonna copy this one underscore love loss and sheer it will be Douglas so let's see you have white Roux white bread we have something Epsilon that's only needed to clip the values and here I want to copy this part I want to put the chair I'll if metric is lock loss then do La Crosse and log loss is also done on probabilities and you're done so let's let's just check lock last ones so we imported predictions true values and just like that we change it to no gloss it's giving us a lot loss and you you can see that that AUC was for the same prediction au 0 0.66 log losses zero point six nine and higher you see is better higher log loss is not good so yeah you get a lot of penalty here so if we try to make the same true predictions 0 0 1 0 1 1 I should get a log losses 0 so this is like a very small value it's almost zero but if I change it a little bit I get a much higher loss and and that's it for right now we have implemented some metrics using cyclone as base in the next sessions we will be implementing some metrics on our own and we will be implementing quite a lot of different types of metrics here for multi-label classification multi-class classification and if you have some cool metrics that you would like to add to this the sender pool request so see you next time bye
Original Description
In this episode of applied machine learning series, we learn about the most basic, but important, #binary #classification metrics and enhance our mlframework with them. We create a classification metrics class which can be expanded to any metric in future.
MLFramework can be found here: http://github.com/abhishekkrthakur/mlframework
Follow me on:
Twitter: https://twitter.com/abhi1thakur
LinkedIn: https://www.linkedin.com/in/abhi1thakur/
Kaggle: https://kaggle.com/abhishek
Watch on YouTube ↗
(saves to browser)
Sign in to unlock AI tutor explanation · ⚡30
Playlist
Uploads from Abhishek Thakur · Abhishek Thakur · 11 of 60
1
 2
2
 3
3
 4
4
 5
5
 6
6
 7
7
 8
8
 9
9
 10
10
 ▶
▶
 12
12
 13
13
 14
14
 15
15
 16
16
 17
17
 18
18
 19
19
 20
20
 21
21
 22
22
 23
23
 24
24
 25
25
 26
26
 27
27
 28
28
 29
29
 30
30
 31
31
 32
32
 33
33
 34
34
 35
35
 36
36
 37
37
 38
38
 39
39
 40
40
 41
41
 42
42
 43
43
 44
44
 45
45
 46
46
 47
47
 48
48
 49
49
 50
50
 51
51
 52
52
 53
53
 54
54
 55
55
 56
56
 57
57
 58
58
 59
59
 60
60

Episode 1.1: Intro and building a machine learning framework
Abhishek Thakur
Episode 1.2: Building an inference for the machine learning framework
Abhishek Thakur
Episode 2: A Cross Validation Framework
Abhishek Thakur
Tips N Tricks #2: Setting up development environment for machine learning
Abhishek Thakur
Episode 3: Handling Categorical Features in Machine Learning Problems
Abhishek Thakur
BERT on Steroids: Fine-tuning BERT for a dataset using PyTorch and Google Cloud TPUs
Abhishek Thakur
Special Announcement: Approaching (almost) any machine learning problem
Abhishek Thakur
Training BERT Language Model From Scratch On TPUs
Abhishek Thakur
Bengali.AI: Handwritten Grapheme Classification Using PyTorch (Part-1)
Abhishek Thakur
Bengali.AI: Handwritten Grapheme Classification Using PyTorch (Part-2)
Abhishek Thakur
Episode 4: Simple and Basic Binary Classification Metrics
Abhishek Thakur
Training Sentiment Model Using BERT and Serving it with Flask API
Abhishek Thakur
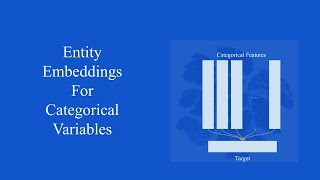
Episode 5: Entity Embeddings for Categorical Variables
Abhishek Thakur
Tips N Tricks #5: 3 Simple and Easy Ways to Cache Functions in Python
Abhishek Thakur
Multi-Lingual Toxic Comment Classification using BERT and TPUs with PyTorch
Abhishek Thakur
Text Extraction From a Corpus Using BERT (AKA Question Answering)
Abhishek Thakur
10K Subscribers: Approaching (almost) Any Machine Learning Problem and Talk Show
Abhishek Thakur
Data Processing For Question & Answering Systems: BERT vs. RoBERTa
Abhishek Thakur
Tips N Tricks #6: How to train multiple deep neural networks on TPUs simultaneously
Abhishek Thakur
Sentencepiece Tokenizer With Offsets For T5, ALBERT, XLM-RoBERTa And Many More
Abhishek Thakur
Talks # 1:Andrey Lukyanenko - Handwritten digit recognition w/ a twist & topic modelling over time
Abhishek Thakur
Episode 6: Simple and Basic Evaluation Metrics For Regression
Abhishek Thakur
Talks # 2: Subhaditya Mukherjee - Image restoration using Deep Learning: Dehazing
Abhishek Thakur
Basic git commands everyone should know about
Abhishek Thakur
How do I start my career in Data Science?
Abhishek Thakur
Talks # 3: Lorenzo Ampil - Introduction to T5 for Sentiment Span Extraction
Abhishek Thakur
Detecting Skin Cancer (Melanoma) With Deep Learning
Abhishek Thakur
Talks # 4: Sebastien Fischman - Pytorch-TabNet: Beating XGBoost on Tabular Data Using Deep Learning
Abhishek Thakur
Build a web-app to serve a deep learning model for skin cancer detection
Abhishek Thakur
Talks # 5: Parul Pandey: Data Science, Diversity and Kaggle
Abhishek Thakur
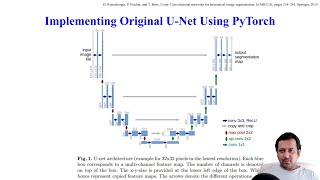
Implementing original U-Net from scratch using PyTorch
Abhishek Thakur
Tips N Tricks # 8: Using automatic mixed precision training with PyTorch 1.6
Abhishek Thakur
Talks # 6: Mani Sarkar: From backend development to machine learning
Abhishek Thakur
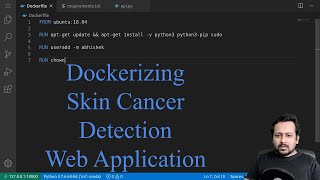
Dockerizing the skin cancer detection web application
Abhishek Thakur
How to train a deep learning model using docker?
Abhishek Thakur
Building an entity extraction model using BERT
Abhishek Thakur
Train custom object detection model with YOLO V5
Abhishek Thakur
Talks # 7: Moez Ali: Machine learning with PyCaret
Abhishek Thakur
How to convert almost any PyTorch model to ONNX and serve it using flask
Abhishek Thakur
Hyperparameter Optimization: This Tutorial Is All You Need
Abhishek Thakur
I finally got a copy of "Approaching (Almost) Any Machine Learning Problem"
Abhishek Thakur
Captcha recognition using PyTorch (Convolutional-RNN + CTC Loss)
Abhishek Thakur
Live Q&A: Getting Started With Data Science
Abhishek Thakur
WTFML: Simple, reusable code for PyTorch models
Abhishek Thakur
Talks # 8: Sebastián Ramírez; Build a machine learning API from scratch with FastAPI
Abhishek Thakur
Data Science PC Configs: From Low Range to Super-High Range
Abhishek Thakur
BERT Model Architectures For Semantic Similarity
Abhishek Thakur
I just got access to GitHub's Codespaces and it's amazing!
Abhishek Thakur
Talks # 9: Vladimir Iglovikov; Detecting Masked Faces In The Pandemic World
Abhishek Thakur
Tips To Build A Good Data Science / Machine Learning Project (For Your Portfolio)
Abhishek Thakur
Docker For Data Scientists
Abhishek Thakur
How To Become A Data Scientist In 1 Year (Learn From A Real World Example)
Abhishek Thakur
Talks # 10: Tanishq Abraham; What are CycleGANs? (a novel deep learning tool in pathology)
Abhishek Thakur
Deploy Any Machine Learning Or Deep Learning Model On Google Cloud Platform (App Engine)
Abhishek Thakur
Pair Programming: Deep Learning Model For Drug Classification With Andrey Lukyanenko
Abhishek Thakur
VS Code (codeserver) on Google Colab / Kaggle / Anywhere
Abhishek Thakur
Talks # 11: Jean-François Puget; Did you know GPUs are not just for Deep Learning?
Abhishek Thakur
End-to-End: Automated Hyperparameter Tuning For Deep Neural Networks
Abhishek Thakur
Deploy Any Machine Learning (or Deep Learning) Endpoint on Google Cloud Platform In 10 minutes
Abhishek Thakur
Ensembling, Blending & Stacking
Abhishek Thakur
More on: Supervised Learning
View skill →


Related Reads
📰
📰
📰
📰
What If Fraud Doesn’t Live in Transactions? What If It Lives Between Them?
Medium · Machine Learning
Embarking on a Journey of Learning: My Milestone at OpenBootcamp
Medium · JavaScript
My honest review of AlgoZenith ( https://maang.in ) after 1 year (June 2025 batch)
Reddit r/learnprogramming
How do you approach a problem in leetcode?
Reddit r/learnprogramming
🎓
Tutor Explanation
