Visualising The Profile Part 3 Watson Personality Insights
Skills:
Data Literacy70%
Key Takeaways
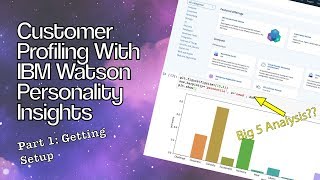
This video demonstrates how to visualize the results from IBM Watson Personality Insights using Matplotlib and Seaborn, creating charts to present customer profiles better.
Full Transcript
all righty what's happening guys welcome to part three in the series on how to use IBM personality insights to create better customer profiles so in the last video of what we did is we created a customer profile for none other than mr. Warren Buffett and we looked at the different parts of the profile that are returned by the service so what we got back are the Big Five personality traits and what percentiles that he ranks against those we looked at needs and we also looked at values so out of that you actually get quite a fair bit of insight into that particular person's personality now what we're gonna do in this video rather than just sticking and analyzing a JSON string we're actually going to throw it all into a data frame and we're going to visualize it using Seabourn and matplotlib so without further ado let's get right into it alrighty cool so jumping back into our Juvonen notebook so we've already got our profile here so if we take a look at our profile again you can see that we've got all of that good stuff and let's just check so yeah all right cool so we're also good so got it all in it now what we're going to do is we're going to start playing around with Seaborn so I guess to get a little bit better visualization going on here let's just create a section and start segmenting this off so we're going to call it visualizing profile and alrighty let's start importing the stuff that we need so we need to import pandas let's import pandas as P do you and then we're going to also need or are we gonna need we're gonna name up four babe to work with Seaborn so important that but yeah babe import pie plot as PLT sorry I should have added Seaborn into there as well Seabourn imports OC one just makes visualization just a little bit nicer right I'm going to import that there's SNS alright cool so that gives us the three key libraries that were sort of going to need for this next step now what we're gonna do is we're going to just visualize the needs bit for now so let's rip that out throw it in a data frame so that Seabourn can accept it and let's start visualizing so if you remember our needs feature is stored inside needs and you can see that here it's just stored in an array so what we can actually do is extract that out and turn it into a data frame so what we'll do is we'll actually go we're going to use a comprehend of this so let's for need in profile that needs and we are going to return back a another array so we're gonna return a dictionary so we want need and we really just want to extract the need name so we want here we'd be wanting challenge and we'd want the percentile as well just to see what what we actually or just to get back what we exactly want so we're going to and we're going to associate the name with the percentile so what we'll do is we'll create a need name so that would be our key and then we're going to use or assign a percentile to that fit alrighty so this should return need name need a percentile and let's just check with formatted that correctly sonido name need a center that should be fine alrighty that looks good and let's just store that in a result variable let's take a look at that perfect all right so we've got a dictionary perfect that has all of our need results good now what we're going to do is we're going to convert that into a data frame so let's call data frame PD data frame and we're going to use the from date method to load this up so we're going to pass through a result and we want to create an index initially so we're going to say orient equals index okay so we've got our data frame and what we want to do is just rename our columns that's right let's reset the index because we want to rename our columns and we're going to say in place it goes true perfect and now we've got no indexes of what will then do is won't brain Emma columns and we're going to call it a need and the center perfect all right so we've got app column down now what we can do is we can actually visualize this with Seaborn so let's do that so let's create a bar plot and we're going say y equals n equals at a percentile and x-axis equals made and the data equals the data frame so and then what we're going to do is run that show perfect are not so perfect looks like it's a little bit small so let's change this figure size and we'll say figure size equals 1 why does so let's try that all righty cool so you can see immediately that's a much better way to visualize the actual need or the the trade profiles or God clearly a high degree of structure practicality curiosity I mean - yeah that I'm probably associated that with warm baths Challenge and practicality is a very practical invested value-based but you can instantly see that you're actually getting some really interesting insights by by doing this type of thing now what we can do is we can again visualize some of the other traits but what we're actually going to do in the next video is we're going to just create a quick function to loop through all of the traits or so that we can pass a particular trait and it it'll visualize it for us simply automatically alrighty guys that about wraps up this video if you found it useful be sure to like share and subscribe you're doing me a huge favor peace
Original Description
Alright, so you’ve mastered the API….or have you?
In this tutorial we’ll run through how to visualise the results from IBM Watson Personality Insights so you can present them better! We’ll use Matplotlib and Seaborn to “create some pretty charts” so you can show them off to all your coworkers.
Want to follow along with the blog post? Check it out here: https://www.nicholasrenotte.com/how-to-develop-customer-profiles-using-ibm-watson-personality-insights/
Want more awesome data and analytics stuff?? Follow me on…
Blog: www.nicholasrenotte.com
Twitter: https://twitter.com/nicholasrenotte
Facebook: https://www.facebook.com/nickrenotte
Watch on YouTube ↗
(saves to browser)
Sign in to unlock AI tutor explanation · ⚡30
Playlist
Uploads from Nicholas Renotte · Nicholas Renotte · 15 of 60
1
 2
2
 3
3
 4
4
 5
5
 6
6
 7
7
 8
8
 9
9
 10
10
 11
11
 12
12
 13
13
 14
14
 ▶
▶
 16
16
 17
17
 18
18
 19
19
 20
20
 21
21
 22
22
 23
23
 24
24
 25
25
 26
26
 27
27
 28
28
 29
29
 30
30
 31
31
![Chatbot App Tutorial with Javascript Node.js [Part 1]](https://i.ytimg.com/vi/D_doogJln14/mqdefault.jpg) 32
32
![Javascript Chatbot From Scratch with React.Js [Part 2]](https://i.ytimg.com/vi/-rejmmjSnHM/mqdefault.jpg) 33
33
 34
34
 35
35
 36
36
 37
37
 38
38
 39
39
 40
40
 41
41
 42
42
 43
43
 44
44
 45
45
 46
46
 47
47
 48
48
 49
49
 50
50
 51
51
 52
52
 53
53
 54
54
 55
55
 56
56
 57
57
 58
58
 59
59
 60
60

Face Detection - Build An Image Classifier with IBM Watson - Part 7
Nicholas Renotte
Food Image Classification - Build An Image Classifier with IBM Watson - Part 6
Nicholas Renotte
General Image Classification - Build An Image Classifier with IBM Watson - Part 5
Nicholas Renotte
Installing Watson Developer Cloud - Build An Image Classifier with IBM Watson - Part 4
Nicholas Renotte
Generating Credentials - Build An Image Classifier with IBM Watson - Part 3
Nicholas Renotte
Creating A Service - Build An Image Classifier with IBM Watson - Part 2
Nicholas Renotte
Getting an IBMid - Build An Image Classifier with IBM Watson - Part 1
Nicholas Renotte
How to Analyse Review Data - Part 2 - Python Yelp Sentiment Analysis
Nicholas Renotte
How to Lemmatize Text - Part 4 - Python Yelp Sentiment Analysis
Nicholas Renotte
How to Calculate Sentiment Using TextBlob - Part 5 - Python Yelp Sentiment Analysis
Nicholas Renotte
How to Collect Business Reviews Using Python - Part 1 - Python Yelp Sentiment Analysis
Nicholas Renotte
How to Clean Text Based Data for NLP - Part 3 - Python Yelp Sentiment Analysis
Nicholas Renotte
How to Setup a IBM Watson Personality Insights Service - Part 1 - Watson Personality Insights
Nicholas Renotte
How to Create a Customer Profile with IBM Watson - Part 2 - Watson Personality Insights
Nicholas Renotte
Visualising The Profile Part 3 Watson Personality Insights
Nicholas Renotte
How to Plot Personality Insights Features at Lightspeed - Part 4 - IBM Watson Personality Insights
Nicholas Renotte
Getting Started With IBM Watson Studio Machine Learning - Part 1 - Predicting Used Car Prices
Nicholas Renotte
Upload and Visualize Data In IBM Watson Studio - Part 2 - Predicting Used Car Prices
Nicholas Renotte
Clean Data and Feature Engineer in IBM Watson Studio - Part 3 - Predict Used Car Prices
Nicholas Renotte
Using Watson Model Builder to Predict Car Prices - Part 4 - Predicting Used Car Prices
Nicholas Renotte
Deploy and Make Predictions With Watson Studio - Part 5 - Predicting Used Car Prices
Nicholas Renotte
Getting Started With IBM Watson Discovery - Part 1 - Stock News Crawler
Nicholas Renotte
How to Run Advanced Queries with Watson Discovery - Part 5 - Stock News Crawler
Nicholas Renotte
How to Run Search Queries with IBM Watson Discovery - Part 4 - Stock News Crawler
Nicholas Renotte
How to Understand the Watson Discovery Data Schema - Part 3 - Stock News Crawler
Nicholas Renotte
How to Build a Watson Discovery Web Crawler - Part 2 - Stock News Crawler
Nicholas Renotte
AI learns what to do next using Tensorflow and Python
Nicholas Renotte
Chatbot Crash Course for Absolute Beginners - Full 20 Minute Tutorial
Nicholas Renotte
Shopify Customer Service Chatbot using Python Automation
Nicholas Renotte
Building a Reddit Keyword Research Chatbot
Nicholas Renotte
Chatbot App Tutorial with Javascript Node.js [Part 1]
Nicholas Renotte
Javascript Chatbot From Scratch with React.Js [Part 2]
Nicholas Renotte
Predicting Churn with Automated Python Machine Learning
Nicholas Renotte
Sales Forecasting in Excel with Machine Learning and Python Automation
Nicholas Renotte
Automate Budgeting with Python and Planning Analytics
Nicholas Renotte
AI vs Machine Learning vs Deep Learning vs Data Science
Nicholas Renotte
Optimizing Marketing Spend using Linear Programming || Marketing Opt PT.1
Nicholas Renotte
Solving Optimization Problems with Python Linear Programming
Nicholas Renotte
Loading Data into Planning Analytics with Python || Marketing Opt PT.2
Nicholas Renotte
Building Marketing Dashboards with Planning Analytics Workspace || Marketing Opt PT.3
Nicholas Renotte
Optimizing Resource Allocation with Docplex and Planning Analytics || Marketing Opt PT.4
Nicholas Renotte
Exploratory Data Analysis With Pandas || Python Machine Learning PT.1
Nicholas Renotte
Preparing Pandas Dataframes for Machine Learning || Python Machine Learning PT.2
Nicholas Renotte
Python Machine Learning with Scikit Learn - Regression || Python Machine Learning PT.3
Nicholas Renotte
Deploying Machine Learning Models with Watson Machine Learning || Python Machine Learning PT.4
Nicholas Renotte
Mind Blowing Machine Learning Apps with Node.JS and Watson Machine Learning || Python ML PT.5
Nicholas Renotte
Build FAST Machine Learning Apps with Javascript React.Js and Watson || Python ML PT.6
Nicholas Renotte
Analyzing Twitter Accounts with Python and Personality Insights
Nicholas Renotte
Converting Speech to Text in 10 Minutes with Python and Watson
Nicholas Renotte
Build a Face Mask Detector in 20 Minutes with Watson and Python
Nicholas Renotte
AI Text to Speech in 10 Minutes with Python and Watson TTS
Nicholas Renotte
Pandas for Data Science in 20 Minutes | Python Crash Course
Nicholas Renotte
Language Translation and Identification in 10 Minutes with Python and Watson AI
Nicholas Renotte
Analyse ANY Conversation in 10 Minutes with Python and Watson Tone Analyser
Nicholas Renotte
Deep Reinforcement Learning Tutorial for Python in 20 Minutes
Nicholas Renotte
NumPy for Beginners in 15 minutes | Python Crash Course
Nicholas Renotte
Real Time Pose Estimation with Tensorflow.Js and Javascript
Nicholas Renotte
Transcribe Video to Text with Python and Watson in 15 Minutes
Nicholas Renotte
Serverless Functions for TM1/Planning Analytics in 20 Minutes
Nicholas Renotte
Building a AI Budget Bot for Planning Analytics with Watson Assistant in 20 Minutes
Nicholas Renotte
More on: Data Literacy
View skill →


Related AI Lessons
⚡
⚡
⚡
⚡
How to prepare TIC teacher exams in Spain with AI (oposiciones 2026)
Dev.to AI
This ChatGPT Prompt Replaced 3 Hours of PowerPoint Work
Medium · AI
This ChatGPT Prompt Replaced 3 Hours of PowerPoint Work
Medium · ChatGPT
How AI Assist Turns a Rough Draft into a Polished Document in Minutes
Dev.to · paperquire
🎓
Tutor Explanation
