How Far Should the NBA 3-Point Line Actually Be?
Skills:
Data Literacy70%
Key Takeaways
The video analyzes the optimal distance for the NBA 3-point line using data science and sports analytics, considering factors such as shot probability and points per shot, and uses tools like GitHub to support the analysis.
Full Transcript
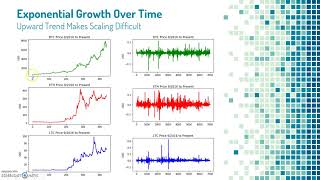
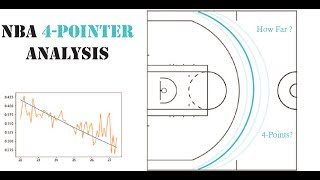
hello everyone can hear I've been reading this book called sprawl ball by Kirk Goldsberry and it's really interesting I've linked it in the description below but it talks about the how the three-point line has changed the incentive structure in basketball so shots at the rim and shots behind the three-point line are worth more points per shot than anything in mid range and the mid-range jumper and mid-range shot used to be a centerpiece of basketball but it's fallen by the wayside because it is a less valuable shot and a lower quality shot than a 3 or a layup in the paint now this change for analytically driven teams is pushing players towards shooting more threes and also taking more layups and it changed the changes the composition of the game the schemes that are run and it also changes the type of players that these teams are looking for the current three-point line around the arc is twenty three point seven five feet away from the rim on the corners it is twenty two feet away from the rim and this asymmetry means that a corner three is actually a better shot than most of the other areas around the arc because it is a little bit closer now I want to determine what the three-point line distance from the rim should actually be using some math I wanted to find a equilibrium between where a three-point would be still part of the game but not necessarily a centerpiece of it as usual if you enjoyed this video please hit that like button and if you want to see similar content like this please subscribe to my channel alright so take a look at this graph the blue line represents the field goal make percentage by distance so as you go further to the right the distance of the shot increases and after right around five feet you can see that there's a fairly linear relationship and it goes down very slowly so that means that again the further away from the rim I am the probability that my shot goes in it decreases very slightly and the important thing is that it has a linear here so if we're looking at a 22-foot shot and a 24-foot shot the make probability is only a few percent different but one has a is worth 50% more points so that gives you an idea about how to almost overvalued the three-point shot is because there's very little difference in the probability of make but a huge difference in the number of points that you actually get this can be illustrated by the orange line right above it that is the points per shot taken from each range as you can see right around 22 feet or the 3-point line and line starts around the corner is when there is a huge spike in the points per shot taken so the question is why would you take a shot that is you know 23 feet versus 24 feet when the 24 footer will go in at roughly the same percent but it'll also give you 50% more points in this other graph I've separated the two pointers and the three pointers by this days so as you can see the blue line represents all three point shots and their points per shot and the orange line represents all two point shots and their points per shot the three point shots all have a higher value even though they're made at a lower percentage here again this just reinforces the idea that this three-point shot is so much more valuable than any twos in mid-range close to the basket is a little bit different story but there's still that huge component of mid-range shots that are frankly bad shots at this point in time in this 2014 through 2015 example the average points per shot for all two-point shots is 0.977 and for 3-point shots the average point per shot is 1.055 so 3-point shots as an aggregate if you're looking at volume as well are worth more than all the two-point shots inside of the line that includes at the rim which is at a fairly high percentage so my thought is that a fair 3-point line would be where all shots inside the 3-point line all two-point shots roughly equal in points per shot two three-point shots that would be the fairest place to put the line that would keep the three-point line relevant but also make it you know more of a competition inside the pan if you want to see my code for how I did this I've posted the Lincoln Kegel as well as the github link in the description below rather than projecting this out I use real shots from the 2014 through 2015 season doing this there was a large enough sample size also using real data I didn't have to project out the volume of shots from different ranges I could just resample using what we currently have to analyze this I wrote a function that just converted three-point shots into two-point shots if they're in side of a certain range so let's say I moved the three-point line to twenty four point five inches it would include all shots inside of that range as two points instead of three point shots now this means that there is a downward trend of you know the value of two point shots because the longer ones are kind of for less but that was smaller than the decrease in value of the three point shots that were coming in my thought was that I would continue to increase the range of the three-point line until the three point shots the expected value was was equal to the expected or the points per shot of the two point shots as you can see on the graph the lines actually do converge the orange line is the three-point shot expected value or points per shot and the blue line is the two point value there it looks like and my data shows that this line converges at around 25 point two feet from the rim and that to me suggests this is a reasonable place for the three-point line to be placed this also got me thinking if they were to move the three-point line how would this affect Steph Curry the greatest 3-point shooter ever so I built another graph of just Steph results looking at his you know points per shot for two points and three points as the line was moved for him and it I will tell you it was fascinating so as you can see the orange line is steps three point points per shot and the blue line is his two point points per shot and this is mind-boggling the shots that he takes outside of you know the regular three-point line his make percentage actually goes up which is astronomical this could be because he's less guarded on these shots he practiced some more etc but he is an absolute anomaly in this field and it's cool to see I mean this graph suggests that he has almost limitless range which is invaluable in the NBA today if we move the three-point line it back to twenty five point two feet staff would still be a very effective shooter he could still help his team but it would normalize a lot of the rest of the field making him a special player maybe even more so again this was a fun analysis there are obviously some challenges and and some some potential holes in the logic in this data was from 2014 to 2015 so it's a relatively small sample and it seems as though the trend towards 3-point shots are increasing even more in the seasons after that so I would love to redo this with you know higher quality newer data and I'd be interested to see what it would show I think we might with that newer data even consider moving the line back a little bit further which would be absolutely fascinating in addition to that this is assuming a you know an equidistant 3-point line rather than it going in on the and the corners or anything like that I think that would probably make more sense in general because these corner threes are so much more valuable as it stands today so another approach I could have tooken with this analysis is I could have used a couple different types of regression to project out the make probability as you get further from the rim as well as the shot quantity as you get further from the rim and with this we could have used lines rather than real data to show something similar in the future I plan to use this methodology to rerun this analysis as well as to project out where a potential for point line might be if they were to introduce that in the NBA I think that'd be fun it'd be a little different approach and it also adds some you know quantitative rigor to some of the rulings that they're making I would love to hear any thoughts or feedback on this analysis in the section below and as usual good luck on your data science journey
Original Description
In this video I walk through my analysis about where the NBA 3-point line should be to maximize fairness in the game. This is based on the work of Kirk Goldsberry in his book Sprawlball (link below).
#DataScience #SportsAnalytics #DataScienceProjects #Basketball
The three point shot has changed the incentive structure within the game of basketball. Players get more points per shot for 3 pointers and for shots at the rim than on any shot in the mid-range. Mid range jumpers used to be a staple of the game, now they are becoming a relic.
As players shoot more threes, the plays that teams employ have begun to shift. The type of players that they are filling their rosters out with are changing as well.
Sprawlball: https://amzn.to/2mib68I
Kaggle Link: https://www.kaggle.com/kjeeone/how-far-should-the-3-point-line-actually-be
Github Link: https://github.com/PlayingNumbers/Nba_3pt
#KenJee
⭕ Subscribe: https://www.youtube.com/c/kenjee1?sub_confirmation=1
🎙 Listen to My Podcast: https://www.youtube.com/c/KensNearestNeighborsPodcast
🕸 Check out My Website - https://kennethjee.com/
✍️Sign up for My Newsletter - https://www.kennethjee.com/newsletter
📚 Books and Products I use - https://www.amazon.com/shop/kenjee (affiliate link)
Partners & Affiliates
🌟 365 Data Science - Courses ( 57% Annual Discount): https://365datascience.pxf.io/P0jbBY
🌟 Interview Query - https://www.interviewquery.com/?ref=kenjee
MORE DATA SCIENCE CONTENT HERE:
🐤My Twitter - https://twitter.com/KenJee_DS
👔 LinkedIn - https://www.linkedin.com/in/kenjee/
📈 Kaggle - https://www.kaggle.com/kenjee
📑 Medium Articles - https://medium.com/@kenneth.b.jee
💻 Github - https://github.com/PlayingNumbers
🏀 My Sports Blog -https://www.playingnumbers.com
Check These Videos Out Next!
My Leaderboard Project: https://www.youtube.com/watch?v=myhoWUrSP7o&ab_channel=KenJee
66 Days of Data: https://www.youtube.com/watch?v=qV_AlRwhI3I&ab_channel=KenJee
How I Would Learn Data Science in 2021: https://www.y
Watch on YouTube ↗
(saves to browser)
Sign in to unlock AI tutor explanation · ⚡30
Playlist
Uploads from Ken Jee · Ken Jee · 40 of 60
1
 2
2
 3
3
 4
4
 5
5
 6
6
 7
7
 8
8
 9
9
 10
10
 11
11
 12
12
 13
13
 14
14
 15
15
 16
16
 17
17
 18
18
 19
19
 20
20
 21
21
 22
22
 23
23
 24
24
 25
25
 26
26
 27
27
 28
28
 29
29
 30
30
 31
31
 32
32
 33
33
 34
34
 35
35
 36
36
 37
37
 38
38
 39
39
 ▶
▶
 41
41
 42
42
 43
43
 44
44
 45
45
 46
46
 47
47
 48
48
 49
49
 50
50
 51
51
 52
52
 53
53
 54
54
 55
55
 56
56
 57
57
 58
58
 59
59
 60
60

Predicting Crypto-Currency Price Using RNN lSTM & GRU
Ken Jee
Predicting Season Long NBA Wins Using Multiple Linear Regression
Ken Jee
How I Became A Data Scientist From a Business Background
Ken Jee
Should You Get A Masters in Data Science?
Ken Jee
How to Simulate NBA Games in Python
Ken Jee
Demystifying Data Science Roles
Ken Jee
The Best Way to Predict NBA Minutes Played
Ken Jee
IT'S NOT TOO LATE TO LEARN CODE!
Ken Jee
My Top 5 Data Science Resources for 2019
Ken Jee
Watch This Before Applying to Data Science Jobs
Ken Jee
Where YOU Should Start With Data Science Projects
Ken Jee
Welcome To My Channel | Ken Jee | Data Science
Ken Jee
Why You DON'T Want to be a WFH Data Scientist
Ken Jee
Was Captain Marvel Bad? A Sentiment Analysis of Twitter Data
Ken Jee
Data Science, Machine Learning, and AI: What's the Difference?
Ken Jee
Data Science: Startup vs. Large Corporation
Ken Jee
Where to Look for Data Science Jobs
Ken Jee
Work From Home Data Scientist: Day in the Life
Ken Jee
Scrape Twitter Data in Python with Twitterscraper Module
Ken Jee
Should You Learn R for Data Science?
Ken Jee
NASA Physicist Turned Data Scientist (Tim Bowling) - KNN EP. 02
Ken Jee
I Wish I Had Known THIS Before Starting in Data Science
Ken Jee
What I Learned From My Three Degrees
Ken Jee
Most Data Science Hopefuls Overlook This Important Skill
Ken Jee
Golf STATS: Strokes Gained Explained
Ken Jee
My Top 5 Data Science Internship Tips
Ken Jee
How I Got My First Data Science Internship (And How You Can Land One)
Ken Jee
Data Science: Pros and Cons
Ken Jee
Data Science Fundamentals: Data Exploration in Python (Pandas)
Ken Jee
Data Science Fundamentals: Data Manipulation in Python (Pandas)
Ken Jee
What Does a Data Scientist Actually Do?
Ken Jee
The Projects You Should Do To Get A Data Science Job
Ken Jee
Take Your Data Science Projects From Good to Great
Ken Jee
How To Get Data Science Experience (Without a Job)
Ken Jee
Data Science Fundamentals: Data Cleaning in Python
Ken Jee
Is Data Science Right For You?
Ken Jee
Thank You For The Support | What's Next | Ken Jee | Data Science
Ken Jee
How To Build A Word Cloud From Scraped Data (Python)
Ken Jee
6 Habits of Successful Data Scientists
Ken Jee
How Far Should the NBA 3-Point Line Actually Be?
Ken Jee
How to Stay Productive & Motivated When Learning Data Science
Ken Jee
Why is Balance Important in Data Science?
Ken Jee
By The Numbers: Where Should The NBA Put a 4 Point Line?
Ken Jee
Why Selling Is An Important Data Science Skill
Ken Jee
Applying Data Science To My YouTube Data: My Surprising Findings
Ken Jee
9 Ways You Can Make Extra Income as a Data Scientist
Ken Jee
Sports Analytics 101: The Pythagorean Theorem of Sports
Ken Jee
Golf: Would You Rather Be the LONGEST or STRAIGHTEST Driver on the PGA Tour?
Ken Jee
Data Science Fundamentals: Linear Regression
Ken Jee
How YOU Can Land a Sports Analytics Job
Ken Jee
The 5 Stages of Data Science Adoption
Ken Jee
Math Needed for Mastering Data Science
Ken Jee
5 Sports Analytics Books to Get You Started
Ken Jee
3 Reasons You Should NOT Become a Data Scientist
Ken Jee
Collision Course: Sports Betting + Data Science
Ken Jee
How to Scrape NBA Data Using the nba_api Python Module
Ken Jee
5 Data Science Resolutions for 2020
Ken Jee
The Data Science Interview: What to Expect
Ken Jee
The 9 Books That Changed My Perspective in 2019
Ken Jee
Questions You Should Ask Your Data Science Interviewers
Ken Jee
More on: Data Literacy
View skill →


Related AI Lessons
⚡
⚡
⚡
⚡
What 116 court judgments taught me about the limits of AI
Medium · AI
Your ChatGPT History Is a Liability. I Fixed That With a $80 Chip and a Pi5.
Medium · AI
Your Skepticism About AI Is an Asset. Here’s How to Use It.
Medium · Programming
The Dark Side of AI: What We Lose When We Stop Thinking
Medium · AI
🎓
Tutor Explanation