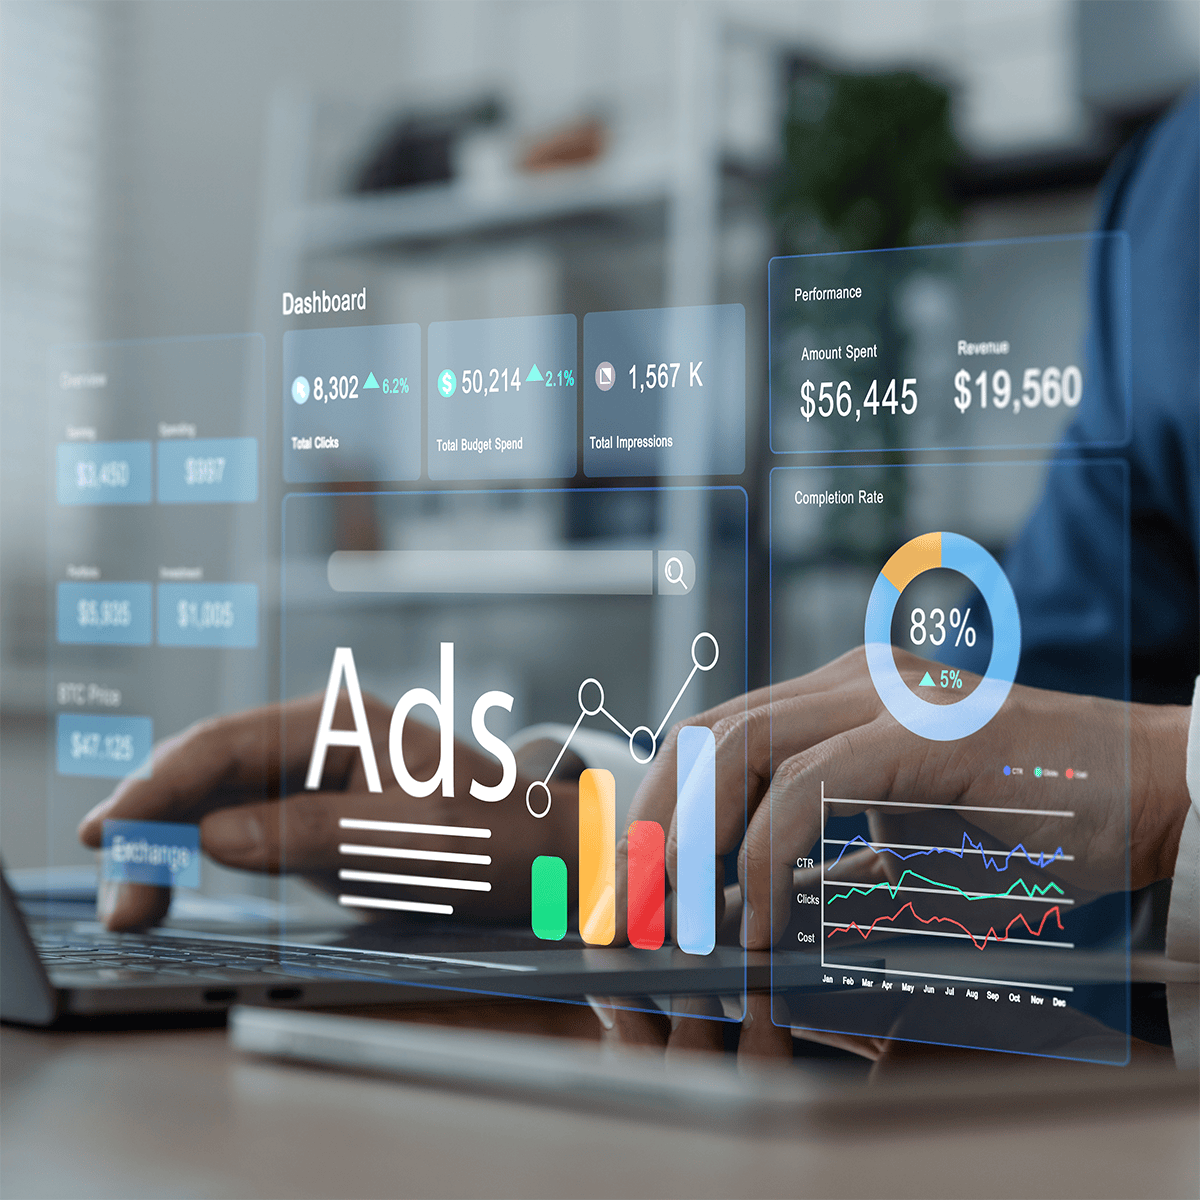
Marketing Dashboards & Data Storytelling with AI
AI-powered analytics are essential for turning marketing data into business impact. This course teaches you to segment audiences, validate data quality, create automated dashboards, and communicate insights that support strategic decisions.
You will learn to leverage AI tools for predictive analytics, build executive-ready visualizations in Looker Studio, and automate reporting workflows that save time while maintaining accuracy. These skills bridge the gap between raw data and actionable insights.
By the end of this course, you will be able to analyze marketing data, create automated dashboards, and present insights that influence decisions and improve campaign performance.
Watch on Coursera ↗
(saves to browser)
Sign in to unlock AI tutor explanation · ⚡30
More on: Data Storytelling
View skill →


Related AI Lessons
⚡
⚡
⚡
⚡
I Tried to Find Out How Close I Am to the CEO of Roblox. The Answer Was Three.
Medium · Data Science
The Dying Symphony of Nature :
How climate change silences Cultures, Species, and Nature.
Medium · Data Science
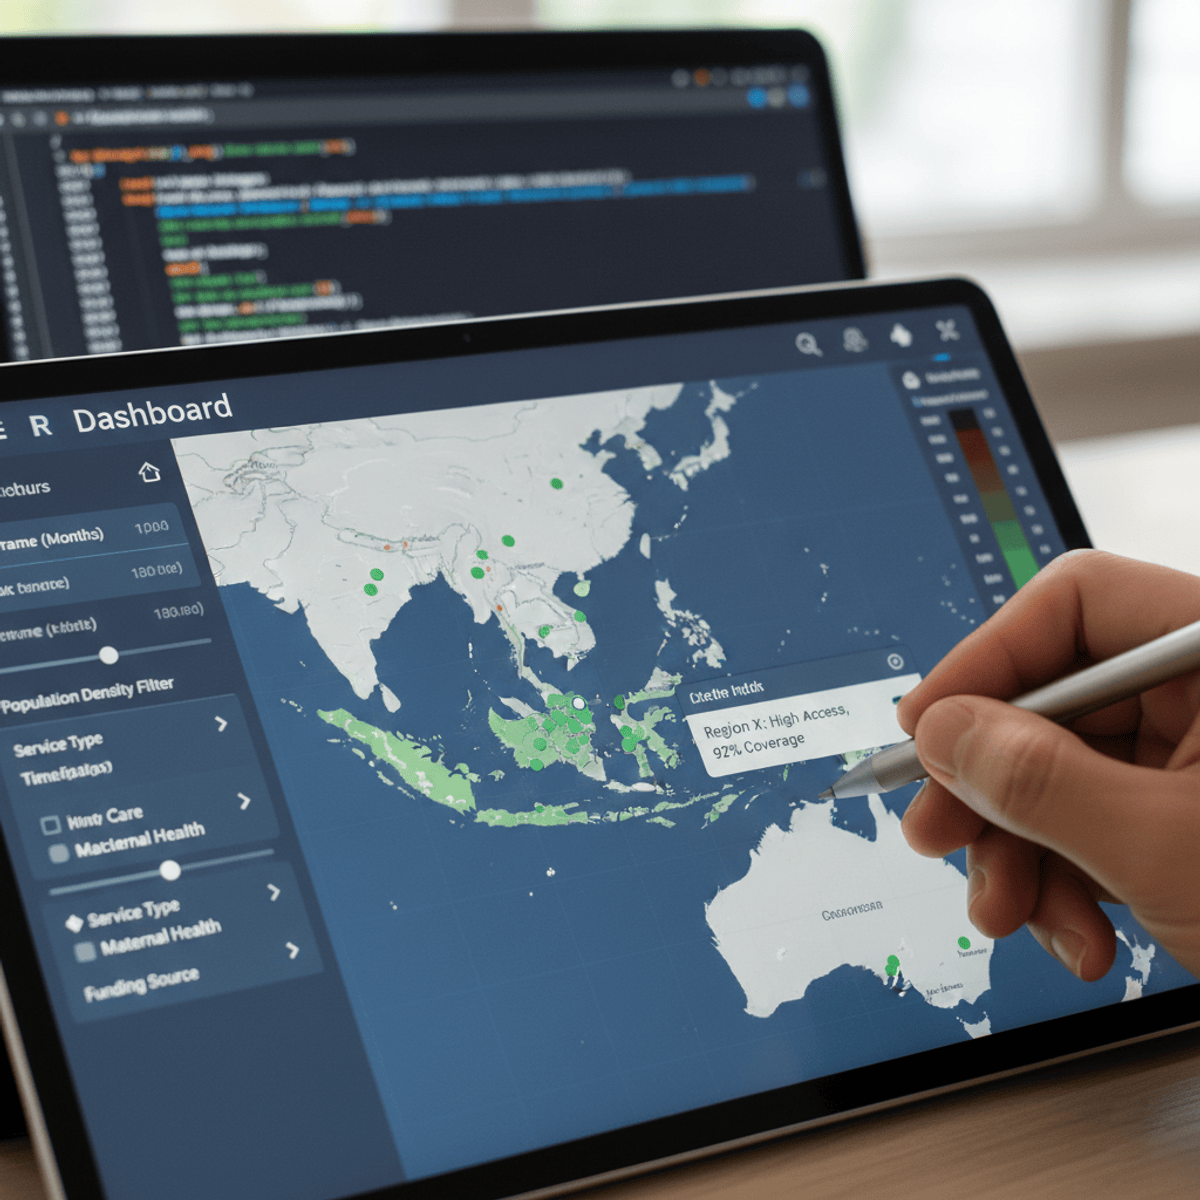
Student Mental Health Analytics: An Interactive Dashboard in R Shiny
Medium · Data Science
Building a US choropleth in Python with plotly express, using a real fragrance dataset
Dev.to · ahmad-khan-97
🎓
Tutor Explanation
