Essential Dashboarding & Storytelling Techniques
This intermediate Tableau course is recommended to learners with some Tableau knowledge. In it, we'll identify basic chart types and when to use them. Then we'll understand typical dashboard-flow techniques and understand how to implement them to guide your viewer from one chart to the next. We'll then start to understand how to use charts to compare values, visualize distributions, and we'll use filters and parameters to make cohesive and interactive dashboards.
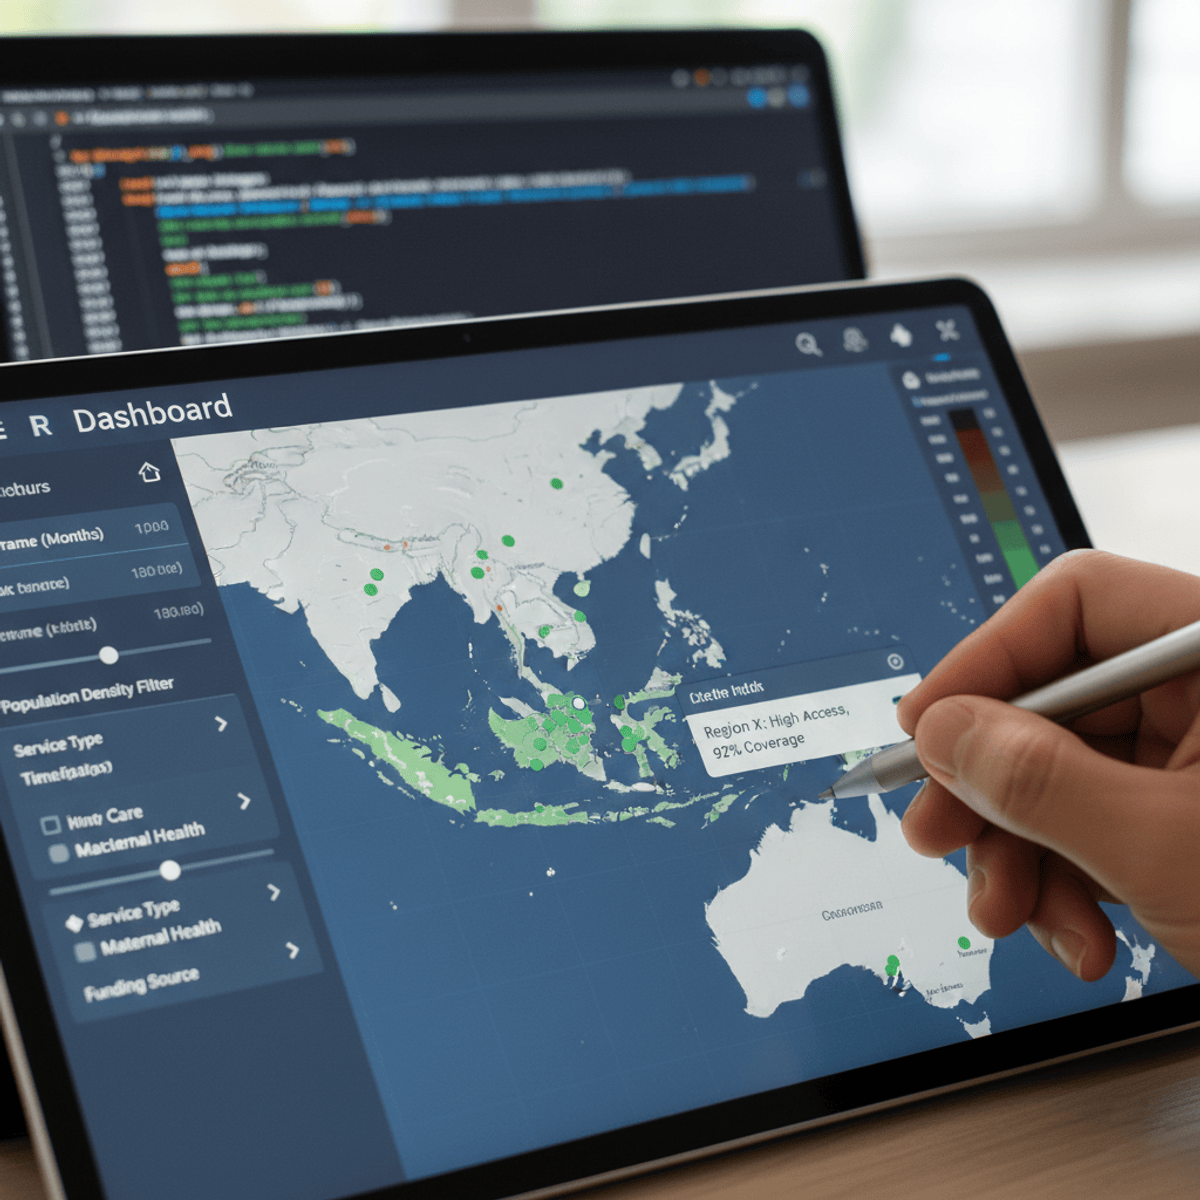
Photo by Bilal Mansuri on Unsplash
Watch on Coursera ↗
(saves to browser)
Sign in to unlock AI tutor explanation · ⚡30
More on: Data Storytelling
View skill →


Related AI Lessons
⚡
⚡
⚡
⚡
Comparing Tools for Intelligent Demand Prediction in Retail
Dev.to AI
Implementing Intelligent Demand Prediction for Grocery Retail
Dev.to AI
Reverse ETL:What It Is, Use Cases, and How to Implement It
Dev.to · BladePipe
Building a Real Estate Data Pipeline That Aggregates 3,000+ Listings Daily from BizBuySell, CREXi &…
Medium · Data Science
🎓
Tutor Explanation