Build Interactive R Shiny Data Apps for NGOs
Skills:
Data Storytelling80%
Key Takeaways
Deploys and manages large language models on AWS using Amazon Bedrock
Original Description
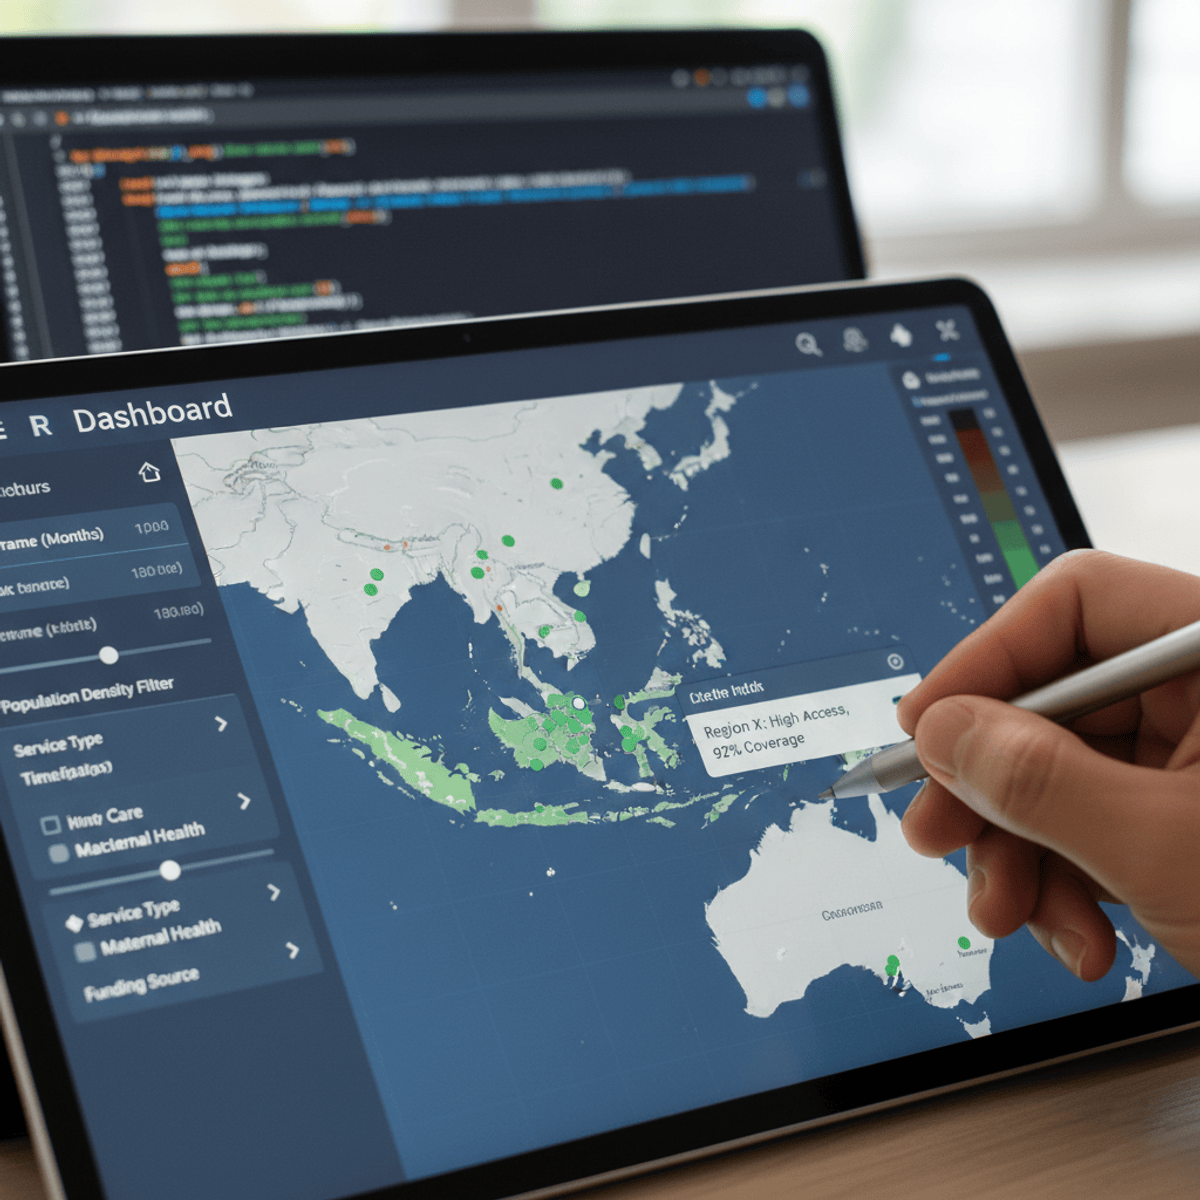
By the end of this course, learners will be able to design, build, and deploy interactive R Shiny web applications to analyze and visualize data for real-world NGO use cases. Learners will gain hands-on experience creating responsive dashboards, implementing reactive programming, customizing visualizations, and enabling user-driven data exploration through advanced input controls.
This course benefits learners by bridging the gap between data analysis and web application development using R, without requiring prior web development knowledge. Participants will learn how to transform static analyses into dynamic, user-friendly applications that empower non-technical stakeholders to interact with data, uncover insights, and support evidence-based decision-making.
What makes this course unique is its project-based, NGO-focused approach, guiding learners step by step through the creation of a complete Shiny application—from foundational concepts and best practices to performance optimization and cloud deployment. Through a comprehensive case study, learners will build a flexible, production-ready data analysis web app while mastering industry-relevant Shiny skills that are directly applicable to social impact, analytics, and data-driven roles.
Watch on External: Coursera ↗
(saves to browser)
Sign in to unlock AI tutor explanation · ⚡30
More on: Data Storytelling
View skill →


Related Reads
📰
📰
📰
📰
Segmentando Clientes com Análise Fatorial e Clustering
Medium · Data Science
From Four Platforms to One: How Tongcheng Travel Built a Unified Data Integration Platform with…
Medium · Data Science
Longitudinal Data Infrastructure
Medium · AI
Longitudinal Data Infrastructure
Medium · Data Science
🎓
Tutor Explanation