Build Interactive Dashboards for Meaningful Insights
Skills:
Data Storytelling80%
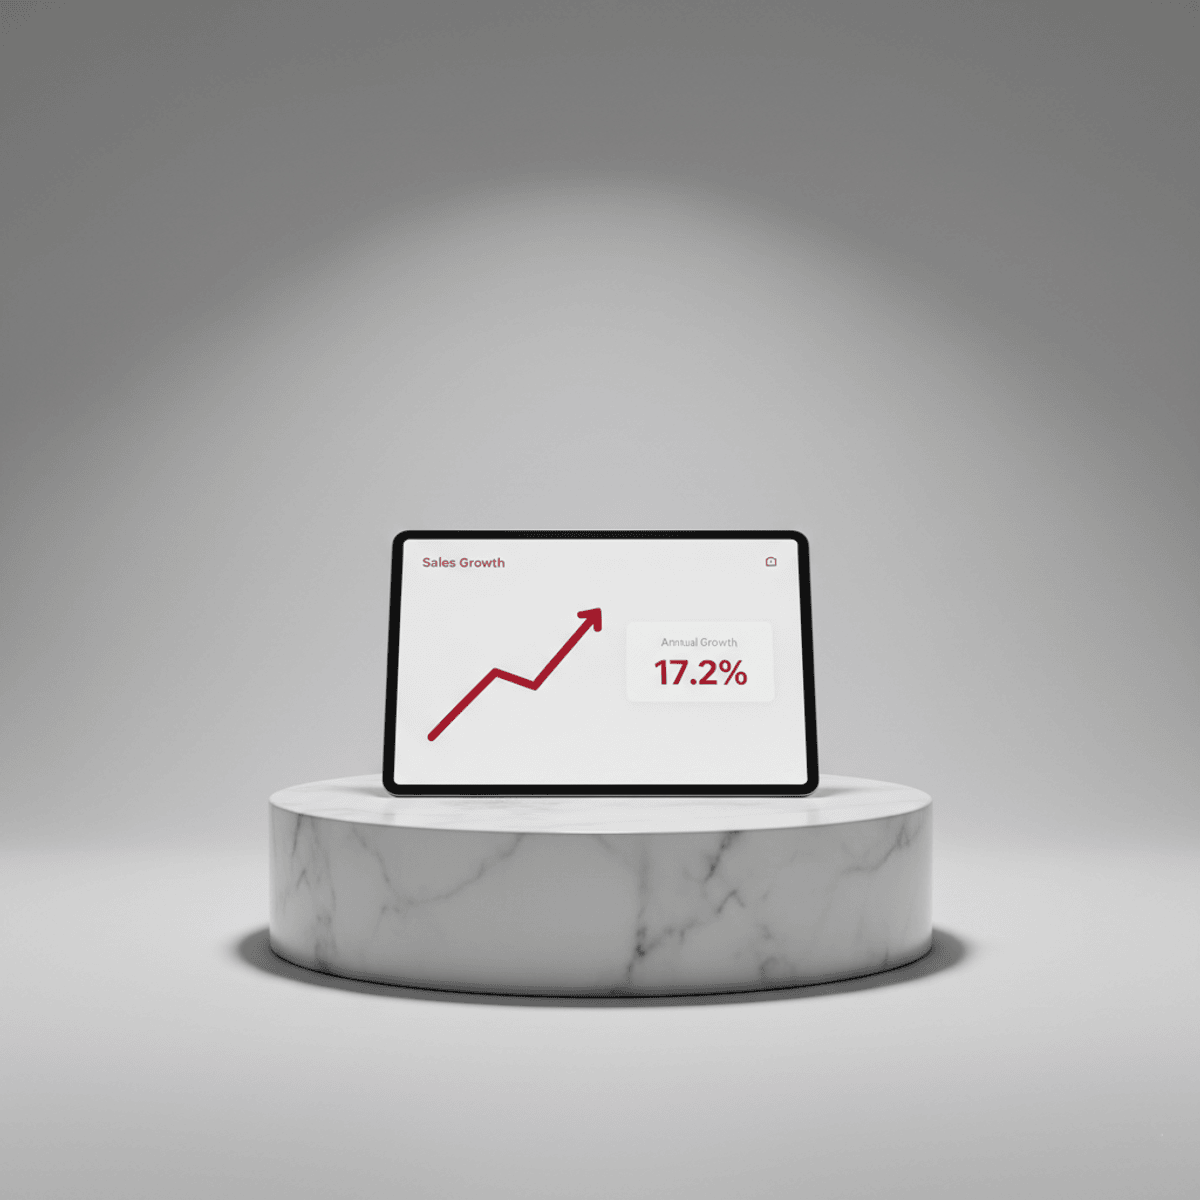
Unlock the power of data storytelling through interactive dashboard design that transforms raw stakeholder requests into meaningful business insights. This course empowers data analysis professionals to bridge the critical gap between business needs and technical implementation, teaching you to systematically decode KPI requests, create comprehensive dashboard specifications, and build self-service funnel visualizations that enable stakeholders to independently explore their data.
By completing this course, you'll master the art of translating complex business requirements into clear technical blueprints and construct interactive dashboards that reveal user behavior patterns, conversion bottlenecks, and growth opportunities. You'll gain hands-on experience with modern dashboard tools while learning to design intuitive interfaces that encourage data-driven decision making across your organization.
By the end of this course, you will be able to:
Understand stakeholder key performance indicator (KPI) requests to produce a dashboard specification.
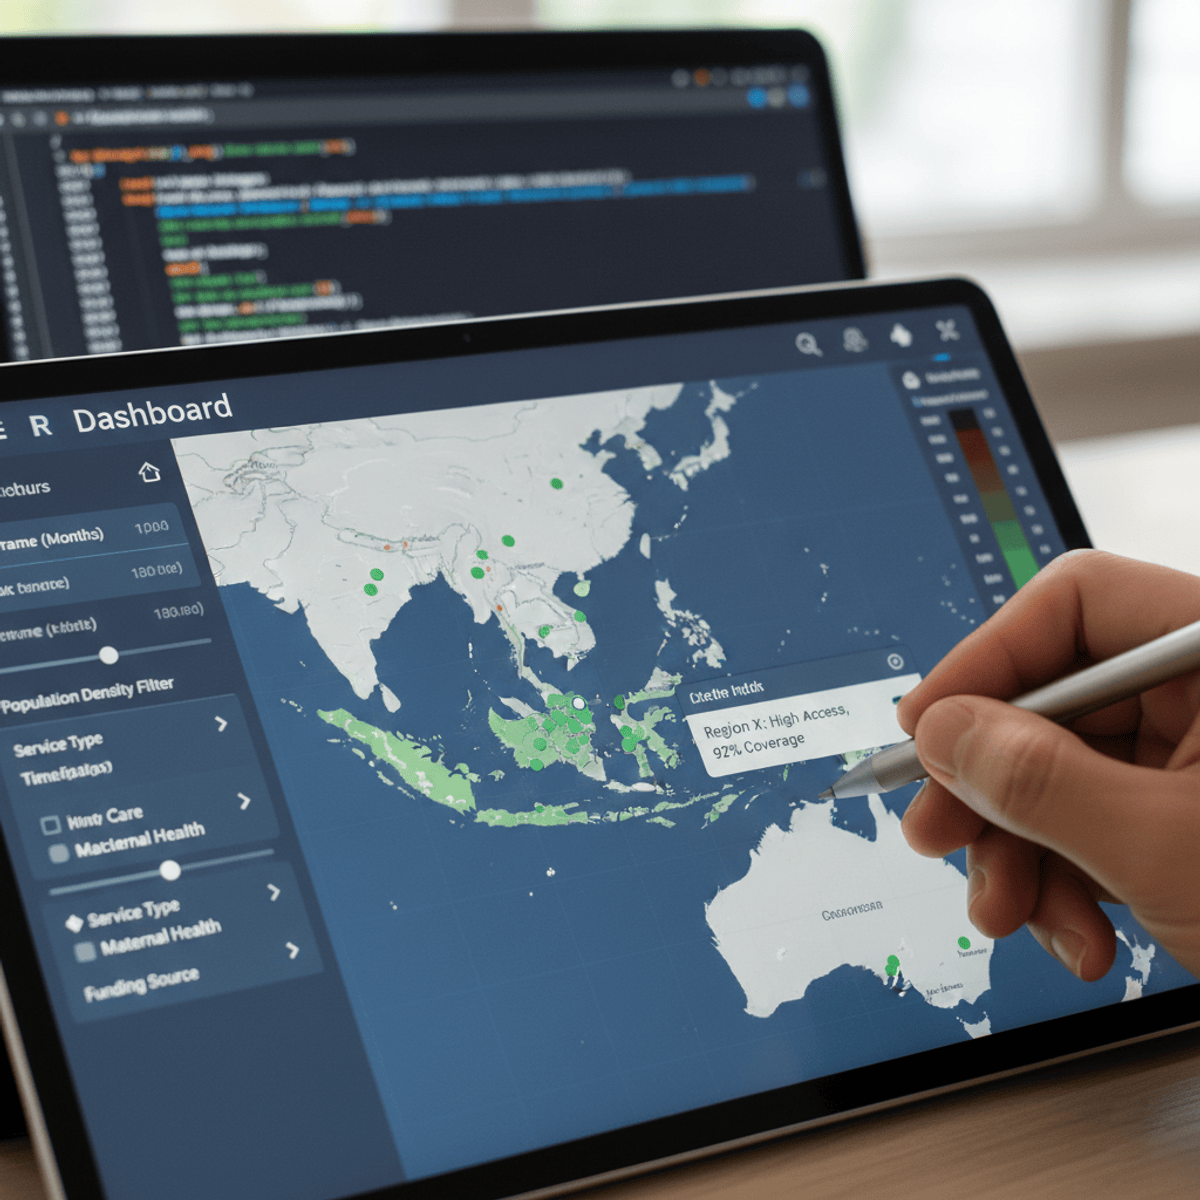
Create a self-service funnel dashboard with drill-through functionality.
This course is unique because it combines strategic requirements gathering with hands-on technical implementation, giving you both the analytical mindset and practical skills needed to deliver dashboards that truly serve business objectives.
To be successful in this course, you should have experience with data analysis tools and basic understanding of business metrics and KPIs.
Watch on Coursera ↗
(saves to browser)
Sign in to unlock AI tutor explanation · ⚡30
More on: Data Storytelling
View skill →


Related AI Lessons
⚡
⚡
⚡
⚡
Quest ROI on AgentHansa: Why Most Agents Pick the Wrong Quests (48-Quest Data Analysis)
Dev.to AI
Your Pipeline Is 8.3h Behind: Catching Business Sentiment Leads with Pulsebit
Dev.to · Pulsebit News Sentiment API
Why Hiring More Data Engineers Won’t Solve Your Delivery Problem
Forbes Innovation
Comparing Tools for Intelligent Demand Prediction in Retail
Dev.to AI
🎓
Tutor Explanation