Basic Statistics in Python (Correlations and T-tests)
Skills:
ML for Analytics80%
Key Takeaways
Uses Python for basic statistics, including t-tests and correlations, and covers exploratory data analysis and data visualization using boxplots
Original Description
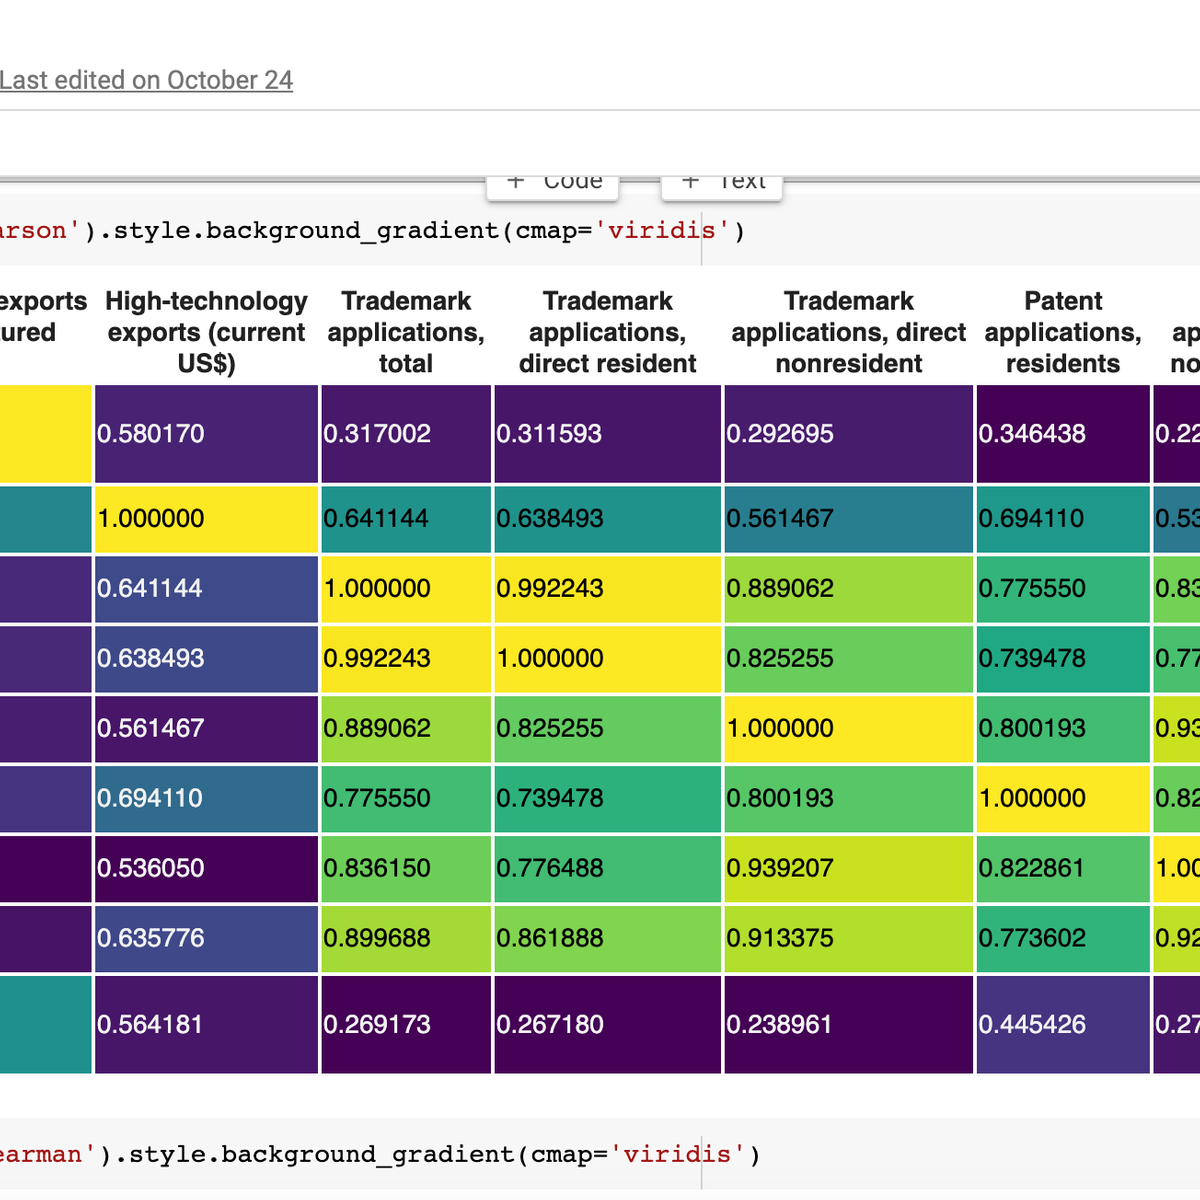
By the end of this project, you will learn how to use Python for basic statistics (including t-tests and correlations). We will learn all the important steps of analysis, including loading, sorting and cleaning data. In this course, we will use exploratory data analysis to understand our data and plot boxplots to visualize the data. Boxplots also allow us to investigate any outliers in our datasets. We will then learn how to examine relationships between the different data using correlations and scatter plots. Finally, we will compare data using t-tests. Throughout this course we will analyse a dataset on Science and Technology from World Bank. The measures in this dataset are numeric, therefore you will learn how to handle and compare numeric data.
This guided project is for anyone with an interest in performing statistical analysis using Python. This could be someone from a social science background with statistics knowledge who wants to advance their analysis, or anyone interested in analysing data.
Watch on External: Coursera ↗
(saves to browser)
Sign in to unlock AI tutor explanation · ⚡30
More on: ML for Analytics
View skill →


Related AI Lessons
🎓
Tutor Explanation
