Simple Parallel Coordinates Plot using d3 js
Skills:
Data Literacy70%
Key Takeaways
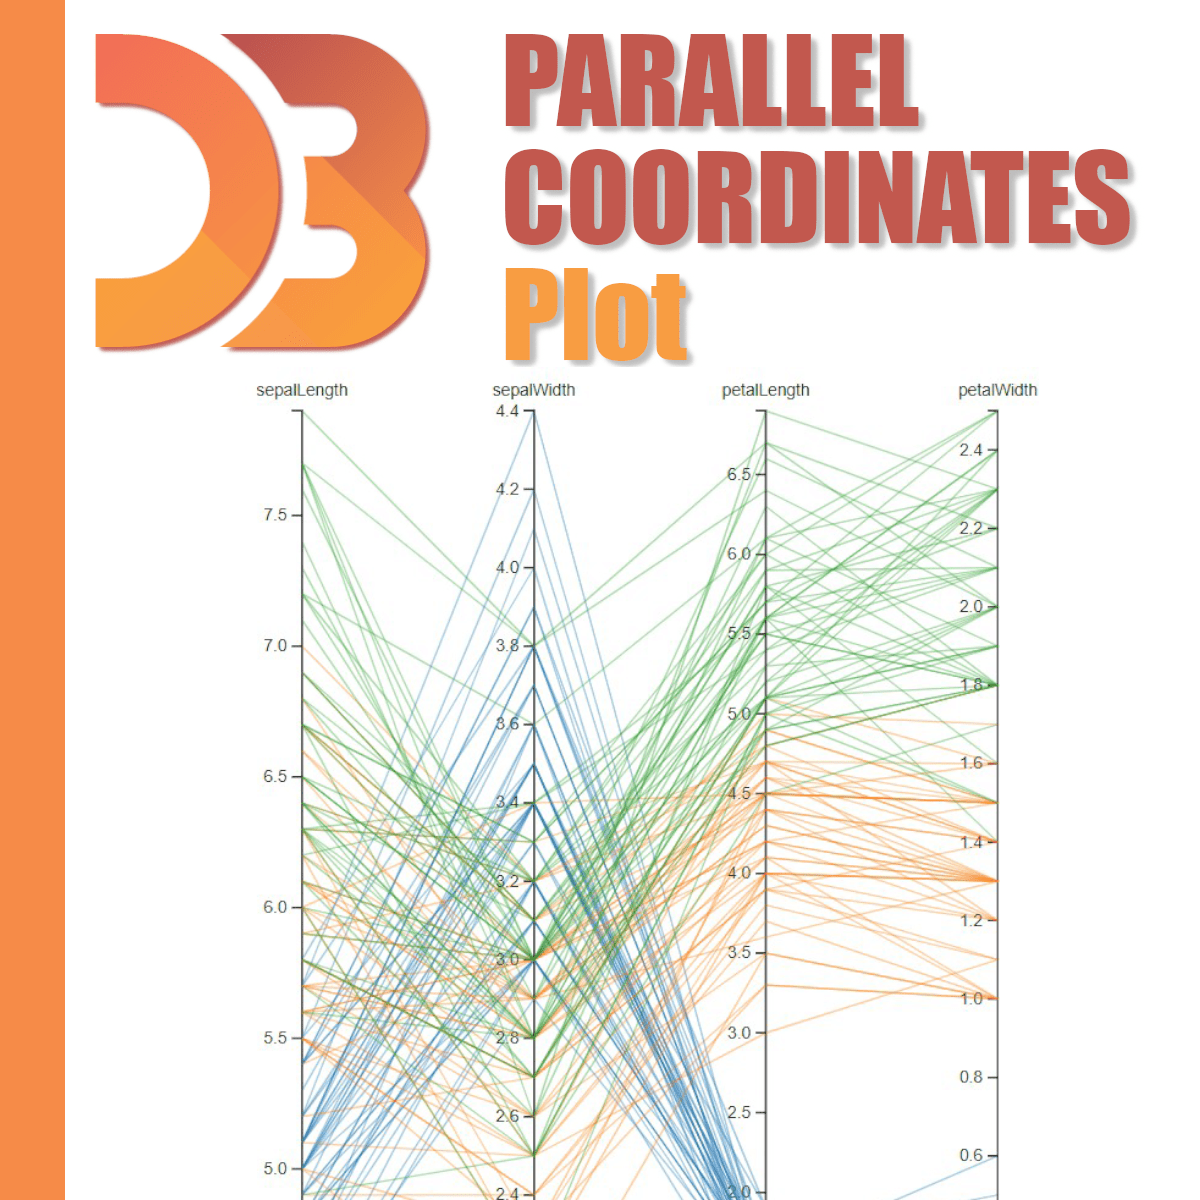
Creates a simple Parallel Coordinates Plot using d3 js for data visualization
Original Description
Throughout this guided project we are going to create a simple Parallel Coordinates Plot (PCP) using d3 js. PCP is one of the most common data visualization techniques used to visualize high-dimensional datasets. In this guided project you will create a simple PCP step by step. We will also cover some important topics in data visualization such as Linear and Ordinal scaling to best visualize our data. Having the knowledge of javascript programming language and the basics of d3 js are the two most important prerequisites to get the most out of this guided project.
Watch on External: Coursera ↗
(saves to browser)
Sign in to unlock AI tutor explanation · ⚡30
More on: Data Literacy
View skill →


Related Reads
📰
📰
📰
📰
Imagine waking up one day only to discover your account has been suspended.
Medium · Data Science
Exploratory Data Analysis: Asking Good Questions of Your Data
Medium · Machine Learning
Exploratory Data Analysis: Asking Good Questions of Your Data
Medium · Data Science
Exploratory Data Analysis: Asking Good Questions of Your Data
Medium · Programming
🎓
Tutor Explanation
