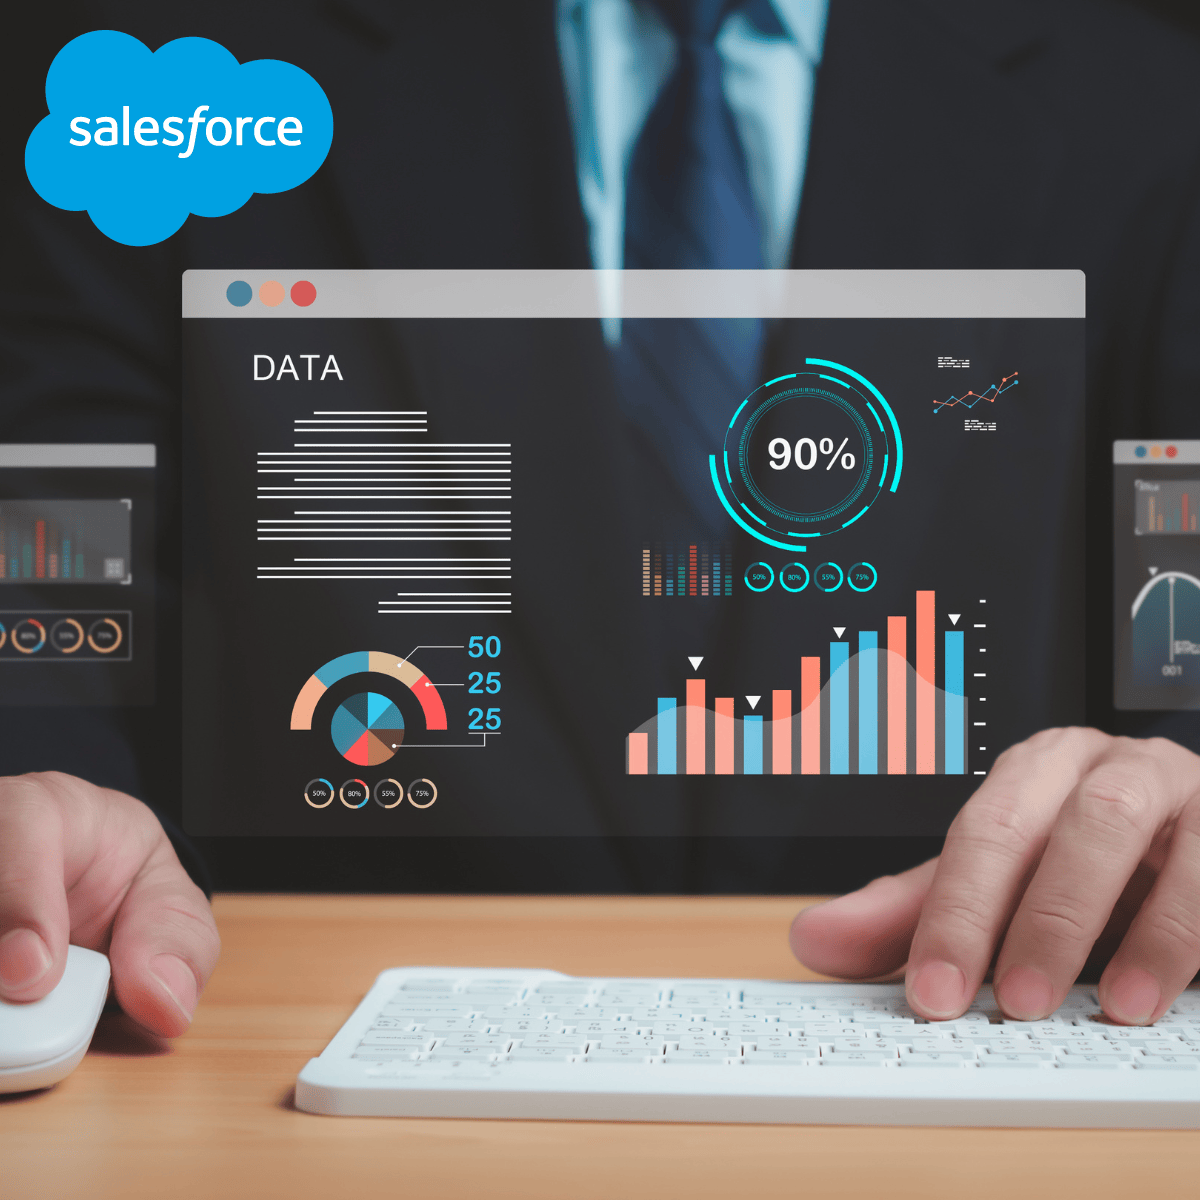
Salesforce Data Management, Reports, and Dashboards
Key Takeaways
Teaches Salesforce data management, report creation, and dashboard development using the Salesforce App Builder
Original Description
Master Salesforce Data Management, Reports, and Dashboards: A Visual Learning Experience.
Want to convert raw data into valuable insights?
This Salesforce App Builder training teaches administrators and app builders how to confidently manage data and create powerful reports and dashboards that drive business decisions.
Through real-world use cases and practical demos, you'll explore best practices for importing, exporting, and cleansing data using tools like Data Loader. Learn how to maintain high-quality datasets that enable consistent and accurate reporting.
You'll learn how to create dynamic and custom reports, as well as how to format data so that it's clear and actionable. Then, use interactive dashboards developed using effective layout principles and personalized components to maximize impact.
This course, which is aligned with the ADM 201 and CRT 403 certification exams, teaches you how to translate data into decisions—both visually and strategically.
By the end, you'll be able to shape business performance rather than simply creating reports. Enroll today and start creating data-driven experiences.
Watch on External: Coursera ↗
(saves to browser)
Sign in to unlock AI tutor explanation · ⚡30
More on: Data Literacy
View skill →









Related Reads
📰
📰
📰
📰
This Engineering Role Grew 729% in 12 Months (And Pays $200K)
Medium · Data Science
Mumbai’s Changing Monsoons: A 55-Year Statistical Deep Dive (1971–2025)
Medium · Python
"Two Markets Disagree About the Fed. Reading Both Without an API Key"
Dev.to · Ken-Mutisya
EP:03 Understanding Data Visualization with Python Libraries Matplotlib and Seaborn
Medium · Python
🎓
Tutor Explanation
 DeepCamp AI