Plot Matplotlib Charts on iTerm2 Terminal | Python DataViz
Skills:
Data Literacy60%
Key Takeaways
Plots Matplotlib charts directly on iTerm2 Terminal using iTermplot
Full Transcript
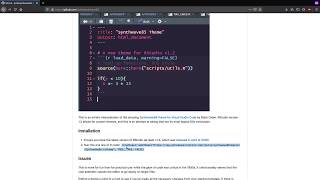
dear fellow coders welcome to one little coder let's say that you are a python programmer especially focused on data science and you use a terminal a lot and but when you want to make charts you may not be able to use your terminal you might have to fall back to jupyter notebook where your matplotlib might get displayed but not on your terminal but don't worry anymore there is an awesome package that i recently came across that can enable show you matplotlib plots on item 2. item 2 is something that is a lot of mac developers use um maybe because mac terminals max symbol terminal is not that great item 2 offers a lot of options so if you are somebody who uses item 2 and you also want to code on matplotlib or you want to display matplotlib charts within your terminal itself this video is for you let's get started so this package this library that i'm talking about currently it's called item plot so this is nothing but a item to back end for matplotlib so that you can directly plot your charts on uh directly on your terminal you don't have to actually go to jupyter notebook and then use it so usually what data scientists do they usually use jupyter notebooks on a web interface to iterate or do ripple but if you like to do it within your terminal this is going to help you a lot so let's get started and then see how to do this thing so the first step is we need to install the package so i'm going to open my item too i've opened my item let me get a big font big font okay make it big okay let me put this in the side put this in this side okay now we are set to go i'm going to say pip 3 install silent item plot because i've already got this package uh installed so it's saying that it's already installed so that's done once you do that thing you have successfully installed item plot so there is one more thing that you need to do which is to enable matplotlib engine for item so you have to export matplotlib uh item plot backend so what you have to do is copy this paste it run it once you are done with this thing the very simple way you can check is you can echo sorry echo mpl backend and then you can see that matplotlib sorry item plot is the back end for your matplotlib so now that is done you can invoke python3 yep and uh import mat plot lib dot pi plot as plt and plt dot plot which is i'm going to give 10 20 200 okay something something and 10 and close the list close the function and you have to always say plot show for this now when you do this thing it's going to ask uh are you ready are you okay to you know download a new file um png i'm going to say remember my choice and then say yes and you can see that it has successfully managed to display the chart so you can see that the chart is available here so the chart that we wanted but maybe the problem is now it doesn't help you do a lot of things interactively and that's where using ipython uh which is nothing but uh the jupiter notebooks terminal version and uh using that you can actually do everything that you do on a jupyter notebook within your terminal so let me show you how to do that um exit after exit let me clear it i'm going to say ipython once i say ipython you can actually see that there is an ipython cell so the first cell second cell third cell so within ipython now i can say import matplot lib.pipe plot as plt so my first cell is i'm importing matplotlib package and my second cell is i'm going to say um i uh sorry plt.plot and very similar to what we did so we have a list and close the list now we have the plot ready so now the next thing i'm going to do is i'm going to say plt.show and run it and you can see that the plot is available now on the next line now i can just press enter and then start iterating further like how i typically do it on my ripple environment i can just say okay instead of this um yeah i didn't write plt dot show and it again displays the chart pld dot plot of um three four five six close and then the chart is ready and then enter it plt for plt dot show and then when i run it you can see both the charts together because you know we are adding charts over charts so this is how you would display matplotlib chart on item 2 which is which is the go to terminal a lot of people mac users usually use so there is one more thing that i wanted to quickly show you which is it is not a simple chart like this but you can actually have uh charts which are you know also complicated so i'm going to copy a code that is available here which is this code that uses numpy and a couple of things to make a network chat so i'm pasting it and you can see the actual chart the network chart is available here so you can if you want you can just copy it um like that file is available if you want you can copy that but if you do not want like you can copy the image and then you know you can share it with um with your team or like on slack or whatever you want to do but if you do not want you can completely iterate it here and ipython also offers you a lot of options to save the notebook which you can check but if you just want to you know do a simple ripple you can simply do um this the the very simple step that you have to do is install item plot uh set the matplotlib back engine as item plot and then you're good to go you can start generating plot either within python shell or with an ipython so like whatever interface that you use you can use it so there is one more thing that you would probably need to know but i am not going to cover in this video is it also supports videos sorry and animations so matplotlib has an animation so you can do a simple animations with matplotlib if you have never done it i've got a video for it i'll link it in the description youtube description you can check it out but if you are used to it you can also display animation within your item terminal shell so you can you can check this thing so only a very simple requirement is you need to have the reverse video and also you need to have image magic installed that's quite simple i'll link this um you a github repository that you're like which you can follow and do it you have a couple of options for you to generate like if you want a resulting gif jeff you can you can do that a lot of these options are available but if you're not bothered about it if you just make a static matplotlib so you like at the end of this video you are good to go and then you can try it out and sadly uh as far as i know from this this is available only for uh at least this package is available only for um mac users who has got i term plot uh sorry i uh item 2 installed so if you do not have item you can click this link and then install item and if you are not using item and you are a mac user you are actually missing out a lot and it also supports dark theme it also supports light theme you can change the theme and then change the plot accordingly if you have any more questions please let me know in the comment section otherwise i hope this small hack is going to help you become a better coder so happy coding stay safe
Original Description
In this Python tutorial, We'll learn how to directly plot Matplotlib Python charts on iTerm 2 Terminal on Mac OS.
iTermplot - Python library - https://github.com/daleroberts/itermplot
Related Videos:
* Matplotlib Animation - https://www.youtube.com/watch?v=qThD1InmsuI
* Matplotlib Animation Tutorial - https://www.youtube.com/watch?v=3Dg80_MJSvo
Watch on YouTube ↗
(saves to browser)
Sign in to unlock AI tutor explanation · ⚡30
Playlist
Uploads from 1littlecoder · 1littlecoder · 0 of 60
← Previous
Next →
1
 2
2
 3
3
 4
4
 5
5
 6
6
 7
7
 8
8
![Create meaningful fake tidy datasets in R using fakir [#rstats Package]](https://i.ytimg.com/vi/EhhljL5zaWs/mqdefault.jpg) 9
9
 10
10
 11
11
 12
12
 13
13
 14
14
 15
15
 16
16
![Android Smartphone Analysis in R [Live Coding Screencast]](https://i.ytimg.com/vi/fv0idLNWfqg/mqdefault.jpg) 17
17
 18
18
 19
19
 20
20
 21
21
![Excel to R - Pivot + Bar Chart in Excel & R using tidyverse [Live Coding]](https://i.ytimg.com/vi/qxkdU5vtmEM/mqdefault.jpg) 22
22
 23
23
 24
24
 25
25
 26
26
 27
27
 28
28
 29
29
 30
30
 31
31
 32
32
 33
33
 34
34
 35
35
 36
36
 37
37
 38
38
 39
39
 40
40
 41
41
 42
42
 43
43
 44
44
 45
45
 46
46
 47
47
 48
48
 49
49
 50
50
 51
51
 52
52
 53
53
 54
54
 55
55
 56
56
 57
57
 58
58
 59
59
![Build GPT-3-like Language Model on Google Colab with minGPT [PyTorch]](https://i.ytimg.com/vi/UNxQmfqHycQ/mqdefault.jpg) 60
60
How to create your Free Data Science Blog on Github with Fastpages from Fastai
1littlecoder
Making Interactive Matplotlib Plots for Data Science Visualizations on Jupyter (Python)
1littlecoder
Create your first Data Science Web App using R Shiny
1littlecoder
How to create a Reproducible Example in R using reprex
1littlecoder
No Code Visualization using esquisse with Tableau-like Drag and Drop GUI in R
1littlecoder
Scrape HTML Table using rvest and Process them for insights using tidyverse in R
1littlecoder
Google Teachable Machine Learning Build No Code AI solution
1littlecoder
Create meaningful fake tidy datasets in R using fakir [#rstats Package]
1littlecoder
How to enable using R Programming with Visual Studio VS Code
1littlecoder
Python, Community, Books - with Abhiram R - Bangpypers Co-organizers | 1littlecoder podcast
1littlecoder
Growing a Tech Community across India - Anubha Maneshwar, Founder Girlscript | 1littlecoder Podcast
1littlecoder
Intro to Google Colab - How to use Colab
1littlecoder
Intro to Plotly Express - Complex Interactive Charts with One-Line of Python Code
1littlecoder
Indic NLP Python Toolkit Open Source Development - iNLTK Creator Gaurav Arora | 1littlecoder Podcast
1littlecoder
Do you want a career in Data Science - Tamil Webinar
1littlecoder
Android Smartphone Analysis in R [Live Coding Screencast]
1littlecoder
Programmatically create Images, Memes, Watermarks using Python with imgmaker
1littlecoder
Kaggle Walkthrough to get you started with Data Science - Webinar
1littlecoder
Community, Corporate Job, Coding - Gnana Lakshmi T C aka Gyan, WomenWhoCode Leadership Fellow
1littlecoder
Easy ggplot2 Theme Customization with {ggeasy} | Data Visualization in R
1littlecoder
Excel to R - Pivot + Bar Chart in Excel & R using tidyverse [Live Coding]
1littlecoder
Excel to R #2 - VLOOKUP in Excel to LEFT_JOIN, MERGE in R
1littlecoder
5 websites to get Free Real-World Datasets for Data Science/ML Projects
1littlecoder
Excel to R #3 - APPROXIMATE VLOOKUP in Excel to FUZZY LEFT_JOIN in R
1littlecoder
Correlation-alternative PPS (Predictive Power Score) Python Package Demo
1littlecoder
Automated Website Screenshots in R using {webshot}
1littlecoder
Installing Custom RStudio Theme (Synthwave85)
1littlecoder
Analyse Google Trends Search Data in R using {gtrendsR}
1littlecoder
3 Tips to ask question on Stack Overflow the right way to get answers
1littlecoder
Learn Data Science with R - Mini Projects - Web Scraping Zomato
1littlecoder
Easily make Dumbbell Chart using {ggcharts} | Data Visualization in R
1littlecoder
GET Hackernews Front Page Results using REST API in R
1littlecoder
Quickly deploy ML WebApps from Google Colab using ngrok
1littlecoder
Use Jupyter Notebooks within VSCode (Visual Studio Code) in 2020
1littlecoder
Plotly Interactive Plots as Pandas Plotting Backend df.plot()
1littlecoder
Stack Overflow Developer Survey 2020 Highlights for New Programmers
1littlecoder
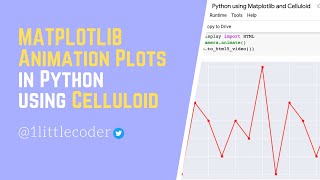
Matplotlib Animation Charts in Python using Celluloid
1littlecoder
Coding, Postwoman, Passion Project Book - Liyas Thomas Open Source Developer - 1littlecoder podcast
1littlecoder
Aspiring Data Scientist, Tips on How to learn Business Domain Knowledge
1littlecoder
Bokeh Interactive Charts as Pandas Plotting Backend df.plot_bokeh()
1littlecoder
Easy Fast Python Pandas Summary with Sidetable | Pandas Tips & Tricks
1littlecoder
Inception, Content Ideas, Consistency - Srivatsan Srinivasan AIEngineering YouTube Content Creator
1littlecoder
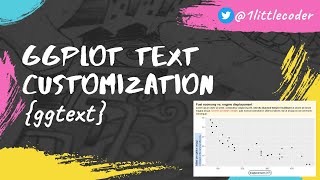
ggplot2 Text Customization with ggtext | Data Visualization in R
1littlecoder
Penguins Dataset Overview - iris alternative | EDA Data Visualization in R
1littlecoder
YouTube Growth Tips, Content Creation - Bhavesh Bhatt, YouTuber (Data Science & Machine Learning) #7
1littlecoder
Matplotlib Animated Bar Chart Race in Python | Data Visualization
1littlecoder
Simple Python GUI Development using {guietta}
1littlecoder
#8 Niche, Growth, Monetization - David Langer - YouTuber Dave on Data
1littlecoder
Simple Fast 3-step Python OCR using Deep Learning 40+ Languages
1littlecoder
Github New Feature Profile Summary/Mini-Resume - Profile Views
1littlecoder
Otto ML Assistant, GPT-3 on Philosophers, Nvidia-ARM - 3 ML Tech News
1littlecoder
What is OpenAI GPT-3 - Hype, Examples, Worries
1littlecoder
Julia 1.5, Datamuse API, Live HDR+ Pixel 4a - Machine Learning Tech News
1littlecoder
Self-driving Car Engineer sentenced, arXiv Dataset, AI/ML Startup Idea - Machine Learning Tech News
1littlecoder
GPT-3 Explorer, Ciphey (Automated Decryption), Py-Sudoku - ML Tech News
1littlecoder
How to use Advanced Google Search to extract Email Ids from Linkedin
1littlecoder
Cartoonizer Toon-IT (AI Web App), GPT-3 Advice, Android Earthquake Detection - ML Tech News
1littlecoder
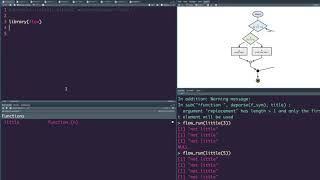
Flow - R Package to visualize code logic, functions as a Flow Diagram
1littlecoder
Build GPT-3-like Language Model on Google Colab with minGPT [PyTorch]
1littlecoder
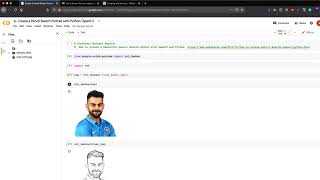
Create a Pencil Sketch Portrait with Python OpenCV
1littlecoder
More on: Data Literacy
View skill →


🎓
Tutor Explanation
