Financial Analytics in RStudio: Identify Profit Drivers
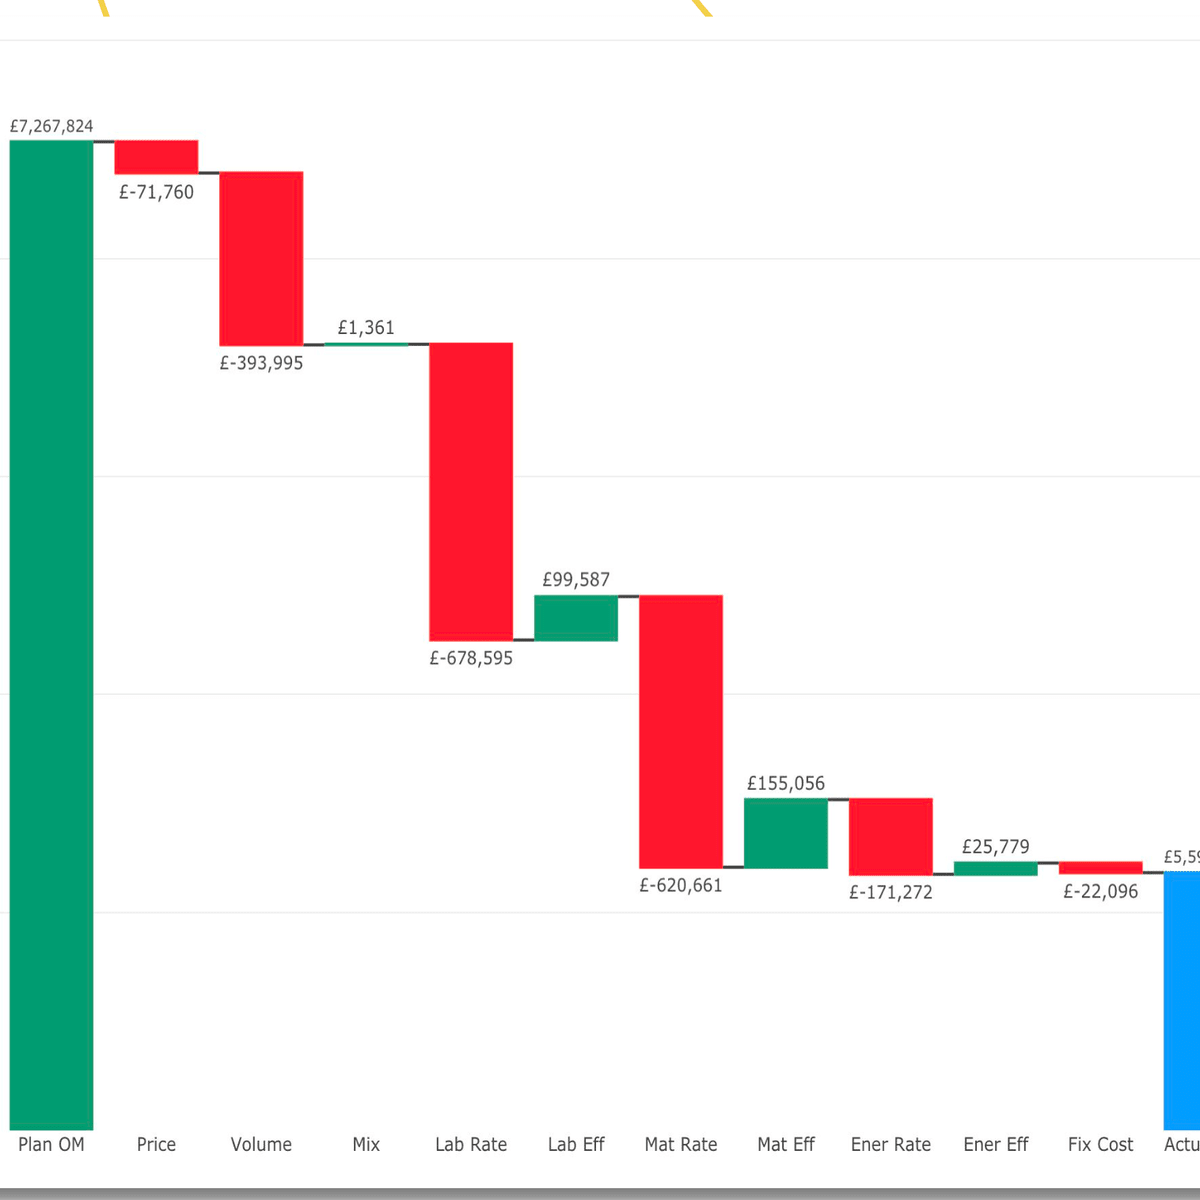
This Guided Project 'Financial Analytics in RStudio: Identify Profit Drivers' is for Supply Chain and/or Operations Analysts. In this 2-hour long project-based course, you will learn how to determine operational & financial performance, calculate Operating Margin (OM), and plot OM waterfall chart showing OM variance drivers.
Watch on Coursera ↗
(saves to browser)
Sign in to unlock AI tutor explanation · ⚡30
Related AI Lessons
⚡
⚡
⚡
⚡
The Case for Keeping Your Analytics Data Off the Cloud
Dev.to AI
Why Most “Innovative” Ideas Fail.
Medium · Data Science
From Raw Data to Risk Classes
Medium · Data Science
Modern businesses Data Analytics vs Data Science: Which Strategy Actually Drives Business Growth in…
Medium · Data Science
🎓
Tutor Explanation