Excel Pivot Table Analysis & Visualization
Key Takeaways
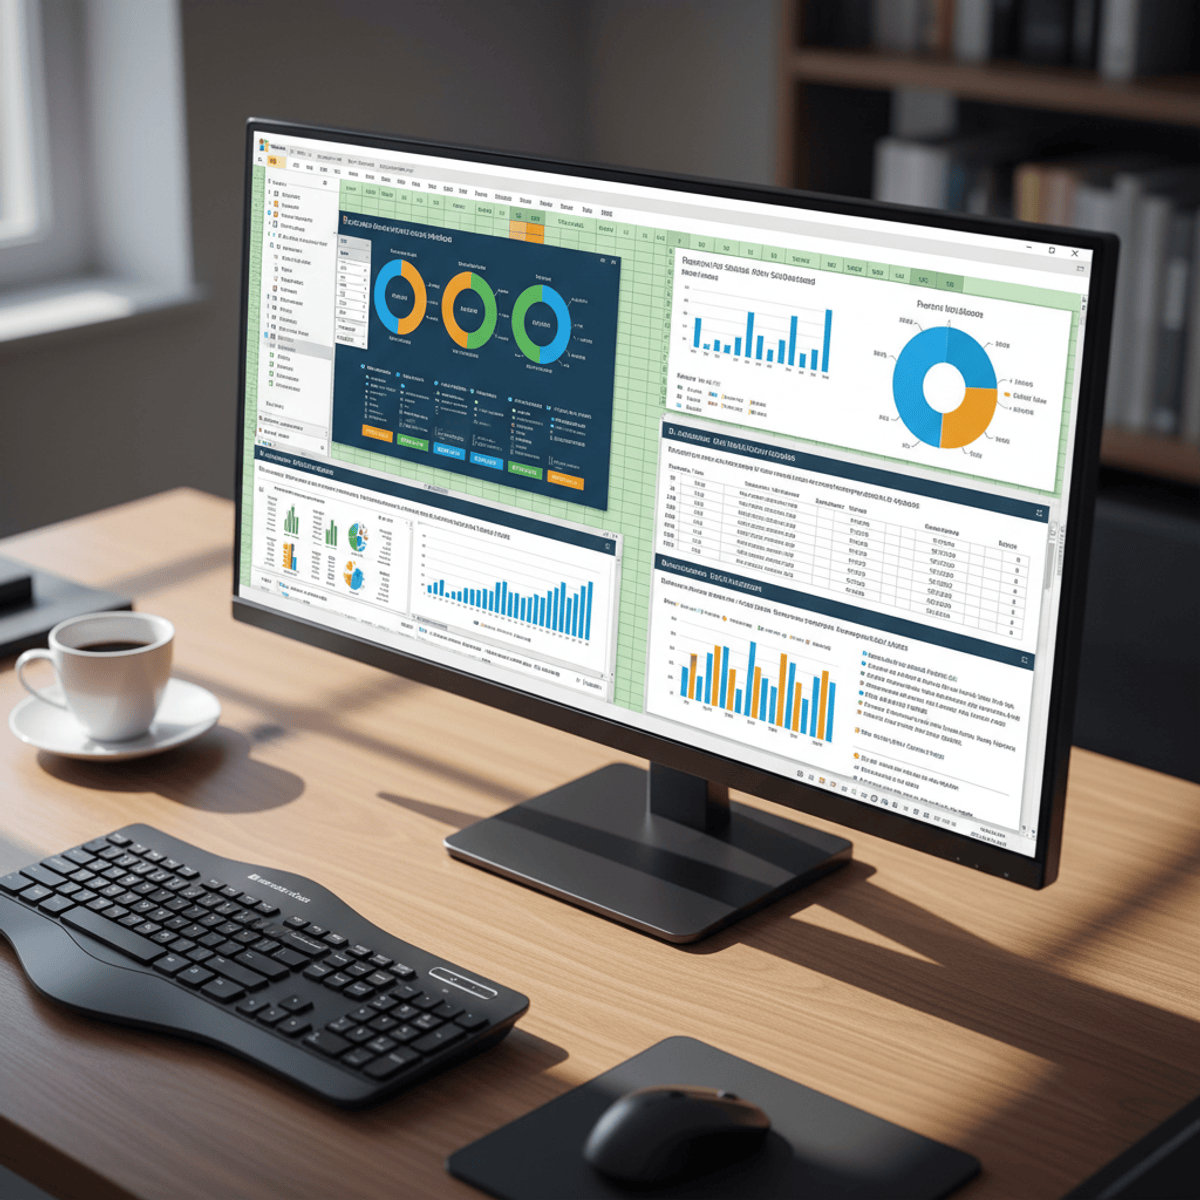
Analyzes and visualizes data with Excel Pivot Tables
Original Description
Master Excel Pivot Tables to analyze, summarize, and visualize large datasets efficiently. Learn how to transform raw data into meaningful business insights using dynamic reports, Pivot Charts, and automated reporting techniques.
This course provides a practical, hands-on approach to Excel Pivot Tables and data analysis. You’ll learn how to organize and structure data, create Pivot Tables, manage layouts, and generate dynamic reports that simplify complex datasets. Whether you work in finance, operations, HR, analytics, or business reporting, this course helps you streamline analysis workflows and improve reporting efficiency.
As you progress, you’ll explore advanced Pivot Table techniques including report filtering, percentage-based analysis, multiple report generation, and dynamic Pivot Charts for visual storytelling. The course also introduces practical problem-solving methods and lookup-based analysis to help learners derive actionable insights from real-world business data.
What makes this course unique is its combination of foundational Excel concepts with practical reporting applications used in professional environments. Instead of focusing only on features, the course emphasizes efficient workflows, analytical thinking, and business-focused data interpretation.
By the end of the course, you’ll be able to confidently create Pivot Tables, automate reporting tasks, analyze large datasets, build visual reports, and support data-driven decision-making using modern Excel data analysis techniques.
Watch on External: Coursera ↗
(saves to browser)
Sign in to unlock AI tutor explanation · ⚡30
More on: Data Literacy
View skill →


Related Reads
📰
📰
📰
📰
Job Hunting? Free Data Tools for Salary, Certification, and Visa Research
Dev.to · datapeek
Python for Data Science — Sampling and Why Your Conclusions Can Be Wrong
Medium · Data Science
Sleep-stage detection is mostly inference. Be honest about it.
Dev.to · SleepTrace
Data Science Institute in Tilak Nagar — AI, ML & Python Training
Medium · Data Science
🎓
Tutor Explanation
