Data Analysis with Spreadsheets and SQL
Key Takeaways
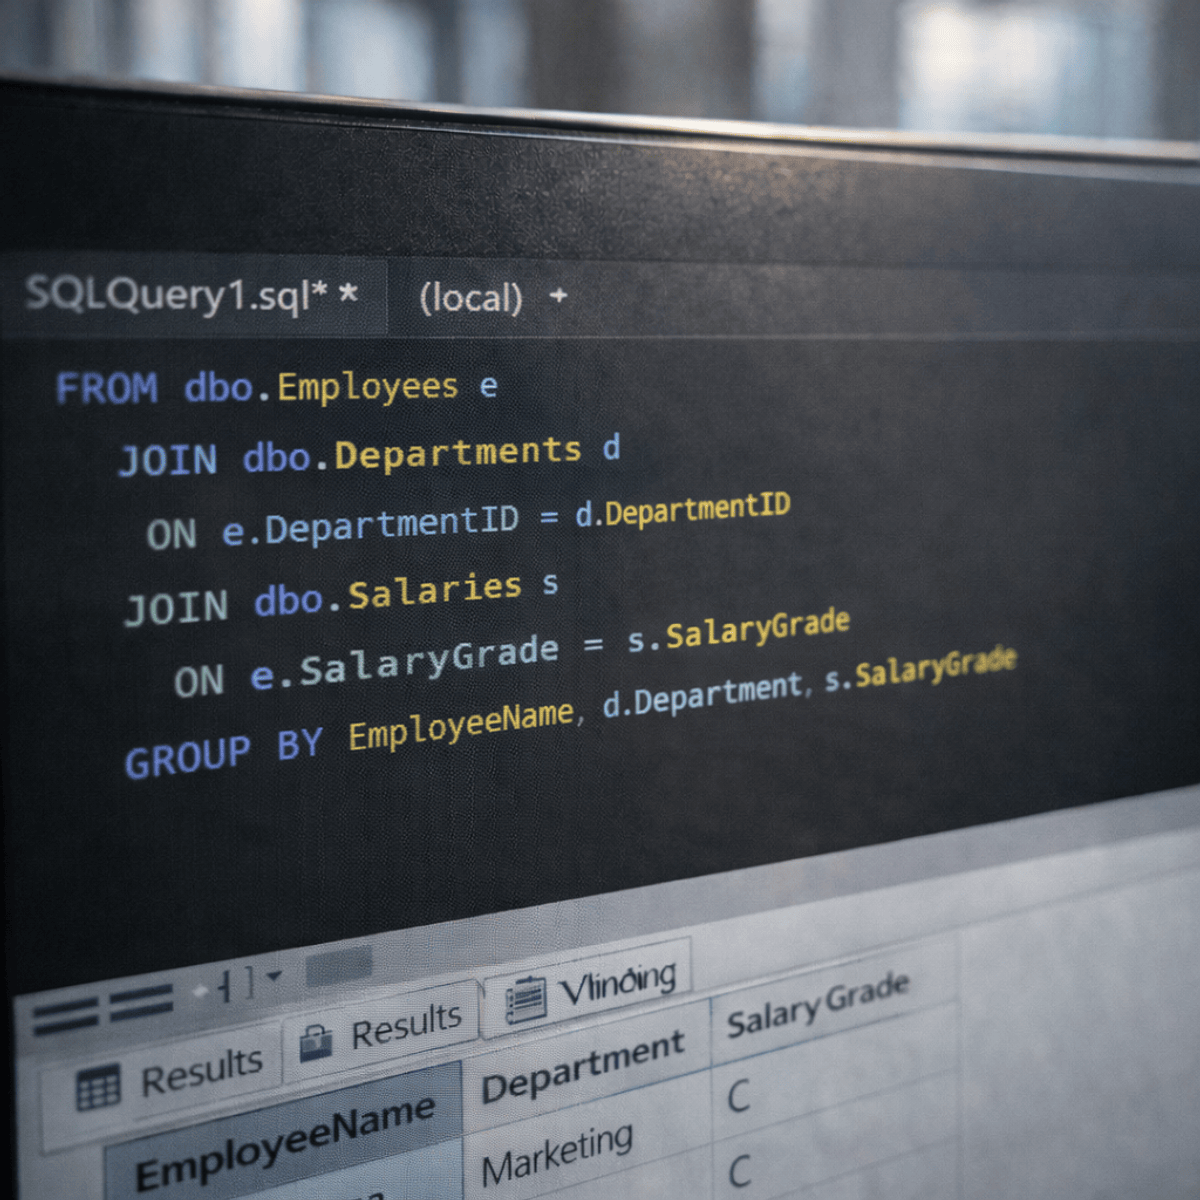
Introduces data analysis with spreadsheets and SQL queries using the OSEMN framework and data visualization techniques
Original Description
This course introduces you to how to use spreadsheets and SQL queries to analyze and extract data. You will learn how to practically apply the OSEMN data analysis framework and spreadsheet functions to clean data, calculate summary statistics, evaluate correlations, and more. You’ll also dive into common data visualization techniques and learn how to use dashboards to tell a story with your data.
By the end of this course you will be able to:
• Clean data with spreadsheets
• Use common spreadsheet formulas to calculate summary statistics
• Identify data trends and patterns
• Write foundational SQL statements and queries to extract data in spreadsheets
• Create charts in Google Sheets and use Tableau to visualize data
• Use dashboards to create data visualizations
You don't need marketing or data analysis experience, but should have basic internet navigation skills and be eager to participate. Ideally you have already completed course 1: Marketing Analytics Foundation and course 2: Introduction to Data Analytics in this program.
Watch on External: Coursera ↗
(saves to browser)
Sign in to unlock AI tutor explanation · ⚡30
More on: SQL Analytics
View skill →


Related AI Lessons
⚡
⚡
⚡
⚡
Müşteri Değerini Anlamak: RFM, CLTV ve Tahmine Dayalı CRM Analitiği
Medium · Machine Learning
Müşteri Değerini Anlamak: RFM, CLTV ve Tahmine Dayalı CRM Analitiği
Medium · Data Science
Müşteri Değerini Anlamak: RFM, CLTV ve Tahmine Dayalı CRM Analitiği
Medium · Python
Surviving the Data Science Behavioral Interview
Towards Data Science
🎓
Tutor Explanation
