Calculating Descriptive Statistics in R
Skills:
Data Literacy90%
Key Takeaways
Teaches how to perform descriptive statistics in R, including frequency and percentage calculations for categorical variables
Original Description
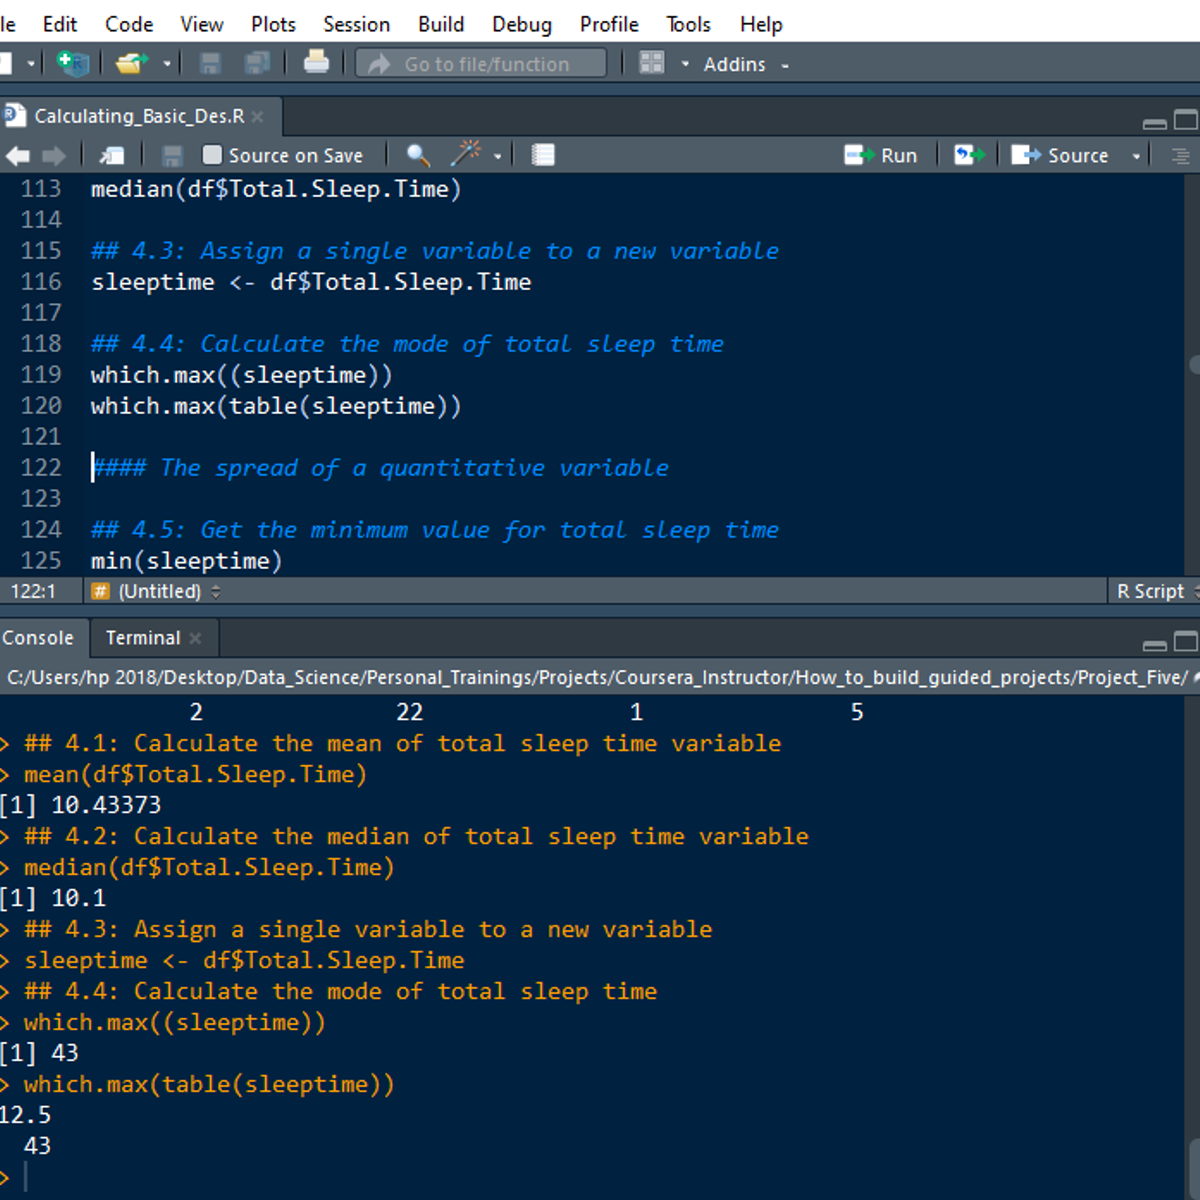
Welcome to this 2-hour long project-based course Calculating Descriptive Statistics in R. In this project, you will learn how to perform extensive descriptive statistics on both quantitative and qualitative variables in R. You will also learn how to calculate the frequency and percentage of categorical variables and check the distribution of quantitative variables. By extension, you will learn how to perform univariate and bivariate statistics for univariate and bivariate variables in R.
Note: You do not need to be a Data Scientist to be successful in this guided project, just a familiarity with basic statistics and using R suffice for this project. If you are not familiar with R and want to learn the basics, start with my previous guided project titled “Getting Started with R”.
Watch on External: Coursera ↗
(saves to browser)
Sign in to unlock AI tutor explanation · ⚡30
More on: Data Literacy
View skill →









🎓
Tutor Explanation

 DeepCamp AI