Build AWS QuickSight Dashboards with Covid-19 Data
By the end of this course, learners will be able to analyze real-world datasets, apply AWS QuickSight features, design effective data visualizations, and build interactive, insight-driven dashboards for business reporting.
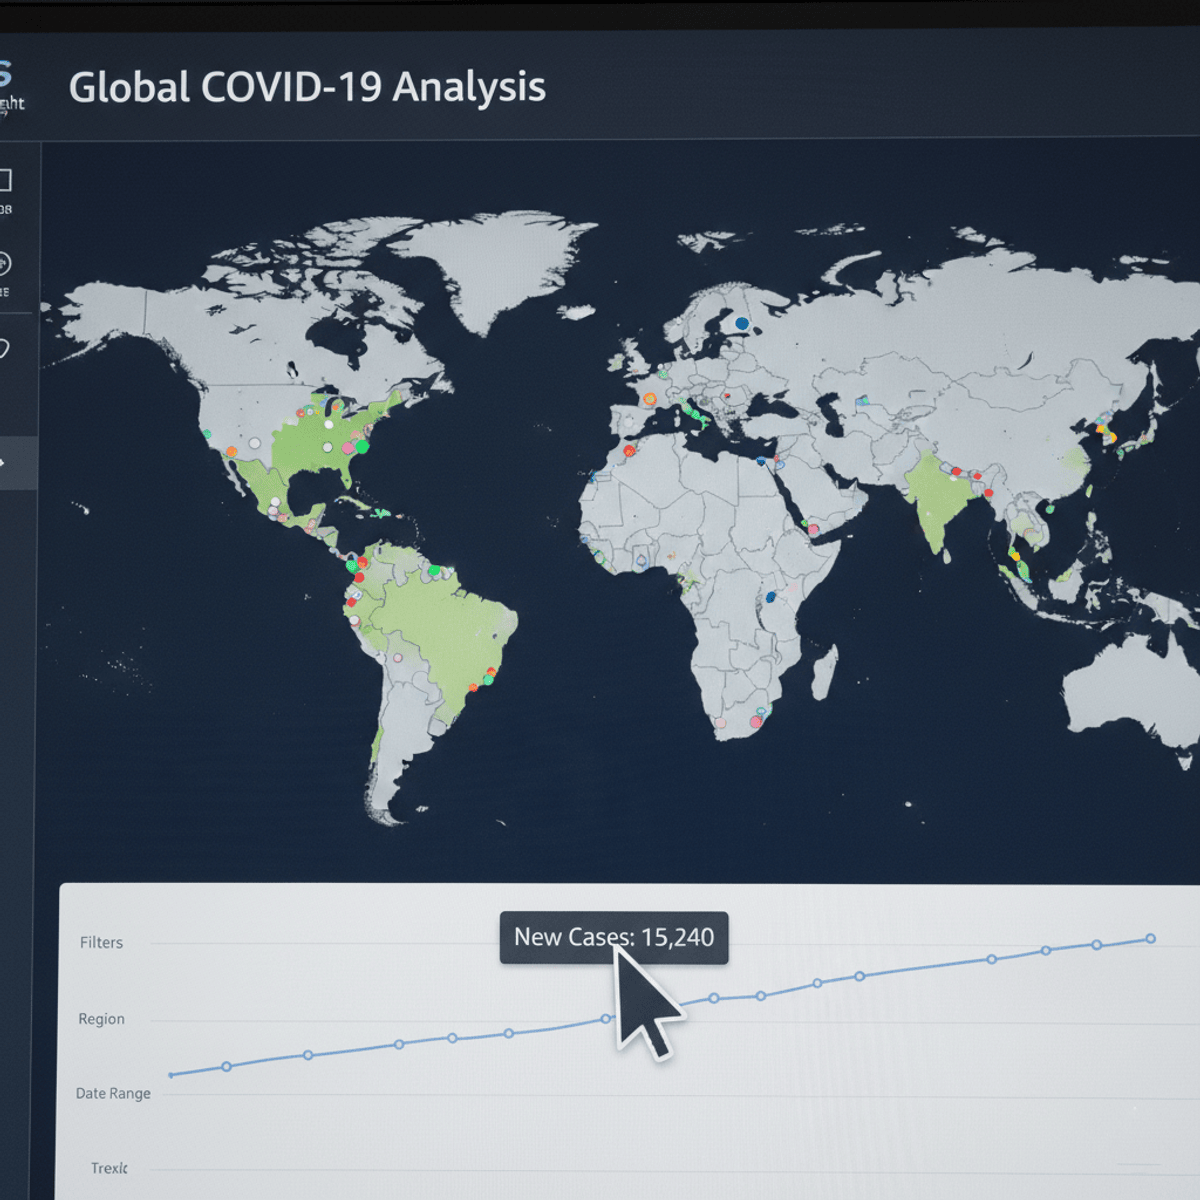
This hands-on course guides learners through a complete AWS QuickSight case study focused on creating a Covid-19 dashboard, helping them move from raw data to polished, shareable analytics solutions. Learners will gain practical experience navigating the AWS Management Console, working with datasets and fields, applying filters, selecting appropriate chart types, and using advanced features such as conditional formatting, multiple sheets, and themes.
What makes this course unique is its end-to-end, project-based approach. Instead of learning isolated features, learners follow a structured workflow that mirrors real-world business intelligence projects. Each step is demonstrated in sequence, ensuring clarity, continuity, and practical relevance.
By completing this course, learners will strengthen their data visualization skills, improve analytical thinking, and build confidence in using AWS QuickSight to communicate insights effectively. This course is ideal for aspiring data analysts, BI professionals, and cloud practitioners who want job-ready, applied experience with AWS analytics tools.
Watch on Coursera ↗
(saves to browser)
Sign in to unlock AI tutor explanation · ⚡30
More on: Data Literacy
View skill →


Related AI Lessons
⚡
⚡
⚡
⚡
Belajar Membuat Grafik Dinamis di Excel Tanpa Coding
Medium · Data Science
The Million-Dollar Pipeline: Under the Hood of Production-Grade Healthcare Data Engineering
Medium · Data Science
The Truth About Performance-Based Stipends in Online Internships
Medium · Data Science
10 Time-Series Problems That Occur When Data Represents States Instead of Events
Medium · Data Science
🎓
Tutor Explanation