Budgeting & Visualize Financial Variances
Budgeting & Visualize Financial Variances is designed for professionals who need to translate complex financial data into clear, actionable insights. You will move beyond basic spreadsheets to master the essential skills of variance analysis and data visualization. The curriculum provides a hands-on approach to transforming raw financial data into a dynamic report, empowering you to immediately enhance your financial analysis and reporting capabilities.
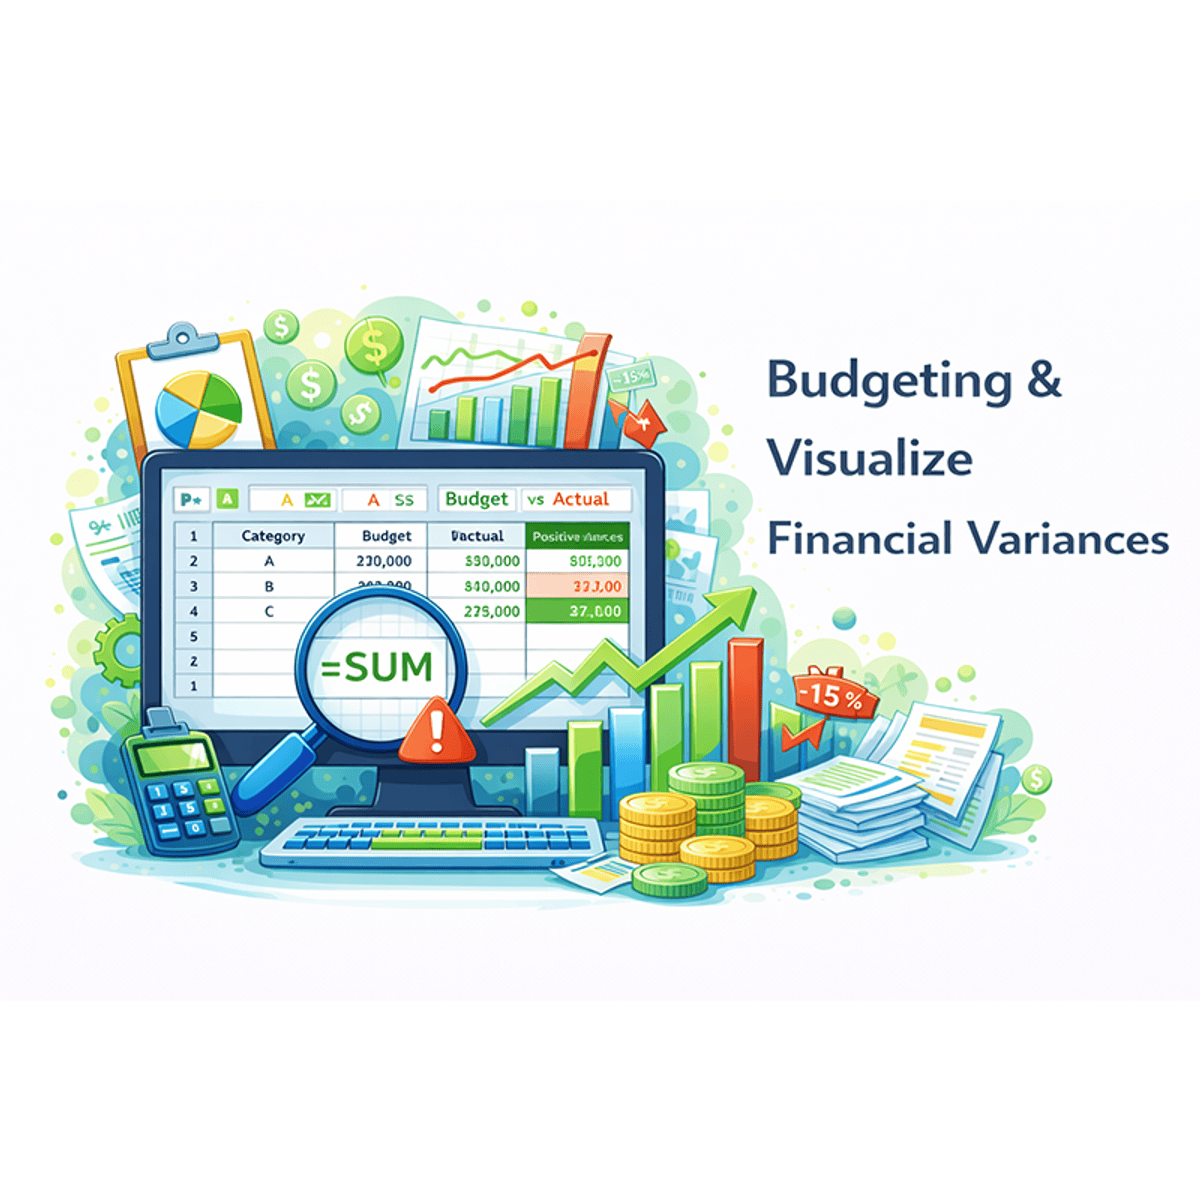
You will learn to define and calculate key financial metrics, including budget, forecast, and variance. Through practical, step-by-step guidance, you will apply conditional formatting rules to automatically highlight critical information, such as cost overruns or savings. The course uses real-world scenarios to build your skills. By the end, you will be able to build and interpret visually intuitive dashboards that enable managers to make faster, more informed decisions based on at-a-glance financial insights. This course is your next step toward mastering data-driven financial storytelling.
Watch on Coursera ↗
(saves to browser)
Sign in to unlock AI tutor explanation · ⚡30
More on: Data Literacy
View skill →


Related AI Lessons
⚡
⚡
⚡
⚡
Quest ROI on AgentHansa: Why Most Agents Pick the Wrong Quests (48-Quest Data Analysis)
Dev.to AI
Your Pipeline Is 8.3h Behind: Catching Business Sentiment Leads with Pulsebit
Dev.to · Pulsebit News Sentiment API
Why Hiring More Data Engineers Won’t Solve Your Delivery Problem
Forbes Innovation
Comparing Tools for Intelligent Demand Prediction in Retail
Dev.to AI
🎓
Tutor Explanation