Apply Statistical Analysis Using Minitab for Beginners
Key Takeaways
Applies statistical analysis using Minitab for data-driven decision-making and creates meaningful data visualizations
Original Description
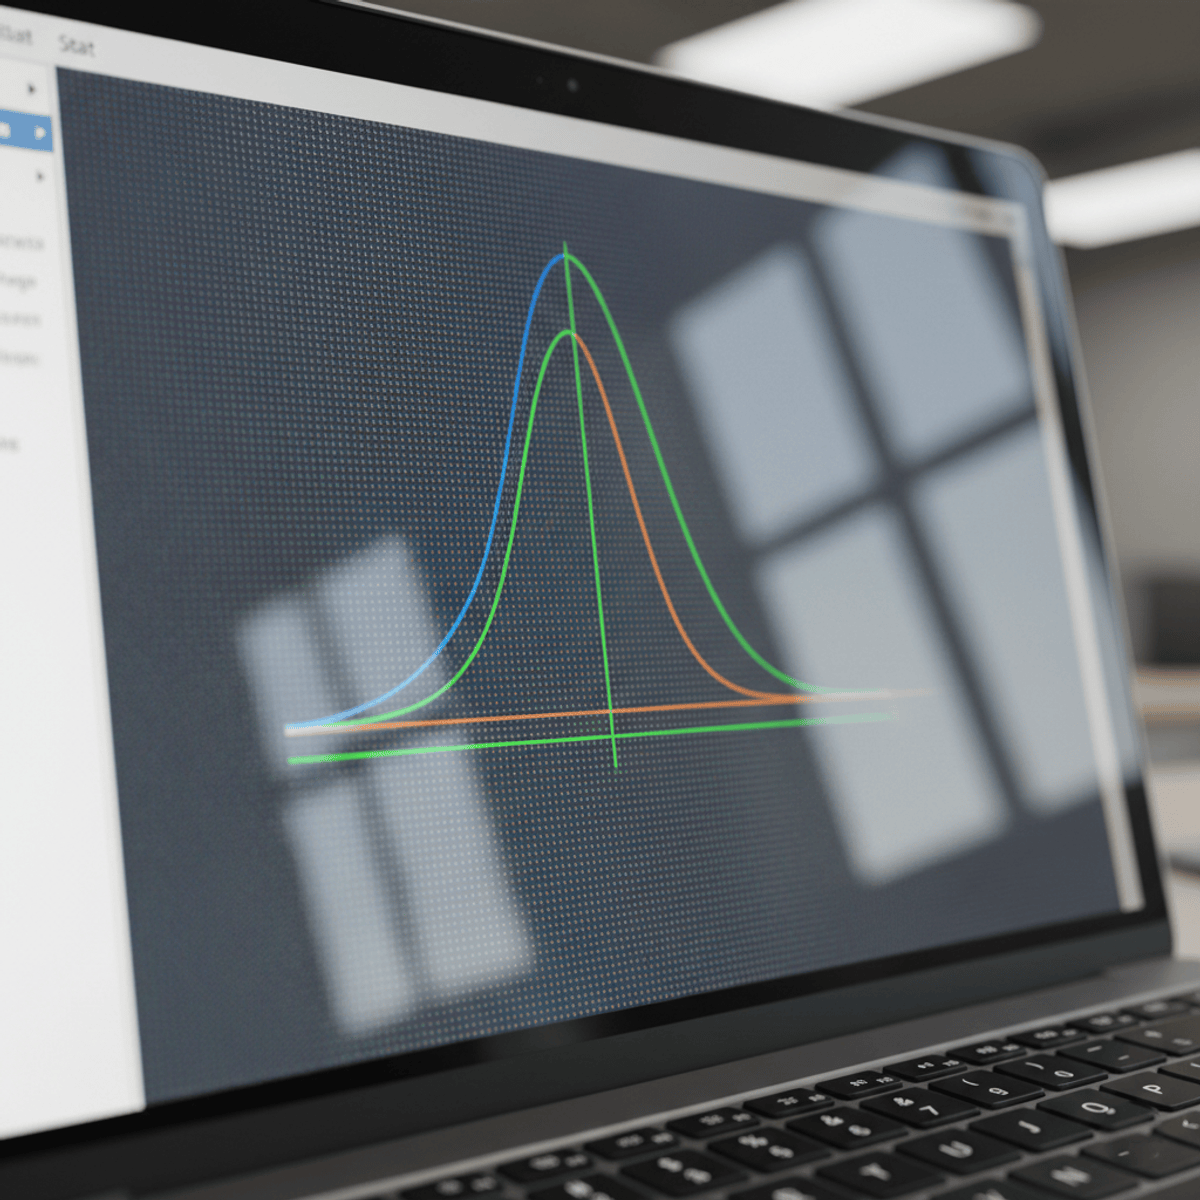
Learners will be able to navigate the Minitab interface, apply essential statistical tools, and create meaningful data visualizations to support data-driven decision-making. By the end of this course, learners will confidently use Minitab’s menus, perform basic statistical analysis, explore predictive analytics features, and interpret graphical outputs such as probability distributions.
This beginner-focused course is designed to provide a structured, hands-on introduction to Minitab without requiring prior statistical or programming experience. Learners benefit from a clear, step-by-step approach that emphasizes practical usage over theory, making complex analytical concepts accessible and easy to apply. Through guided demonstrations, menu-driven workflows, and visual assistants, learners quickly build confidence in working with real datasets.
What makes this course unique is its emphasis on learning Minitab through exploration of its interface and tools exactly as they are used in professional environments. Instead of overwhelming learners with formulas or advanced techniques, the course focuses on developing practical skills that can be immediately applied in quality management, operations, analytics, and academic projects. This makes the course ideal for students, professionals, and beginners seeking a fast, effective entry into statistical analysis using Minitab.
Watch on External: Coursera ↗
(saves to browser)
Sign in to unlock AI tutor explanation · ⚡30
More on: Data Literacy
View skill →


Related Reads
🎓
Tutor Explanation
