Apply Data Analytics with Minitab for Business Decisions
Skills:
Data Literacy90%
By the end of this course, learners will be able to apply statistical data analytics techniques using Minitab and Excel, interpret business data through descriptive and inferential methods, evaluate relationships using correlation and ANOVA, and support data-driven business decisions through real-world case studies.
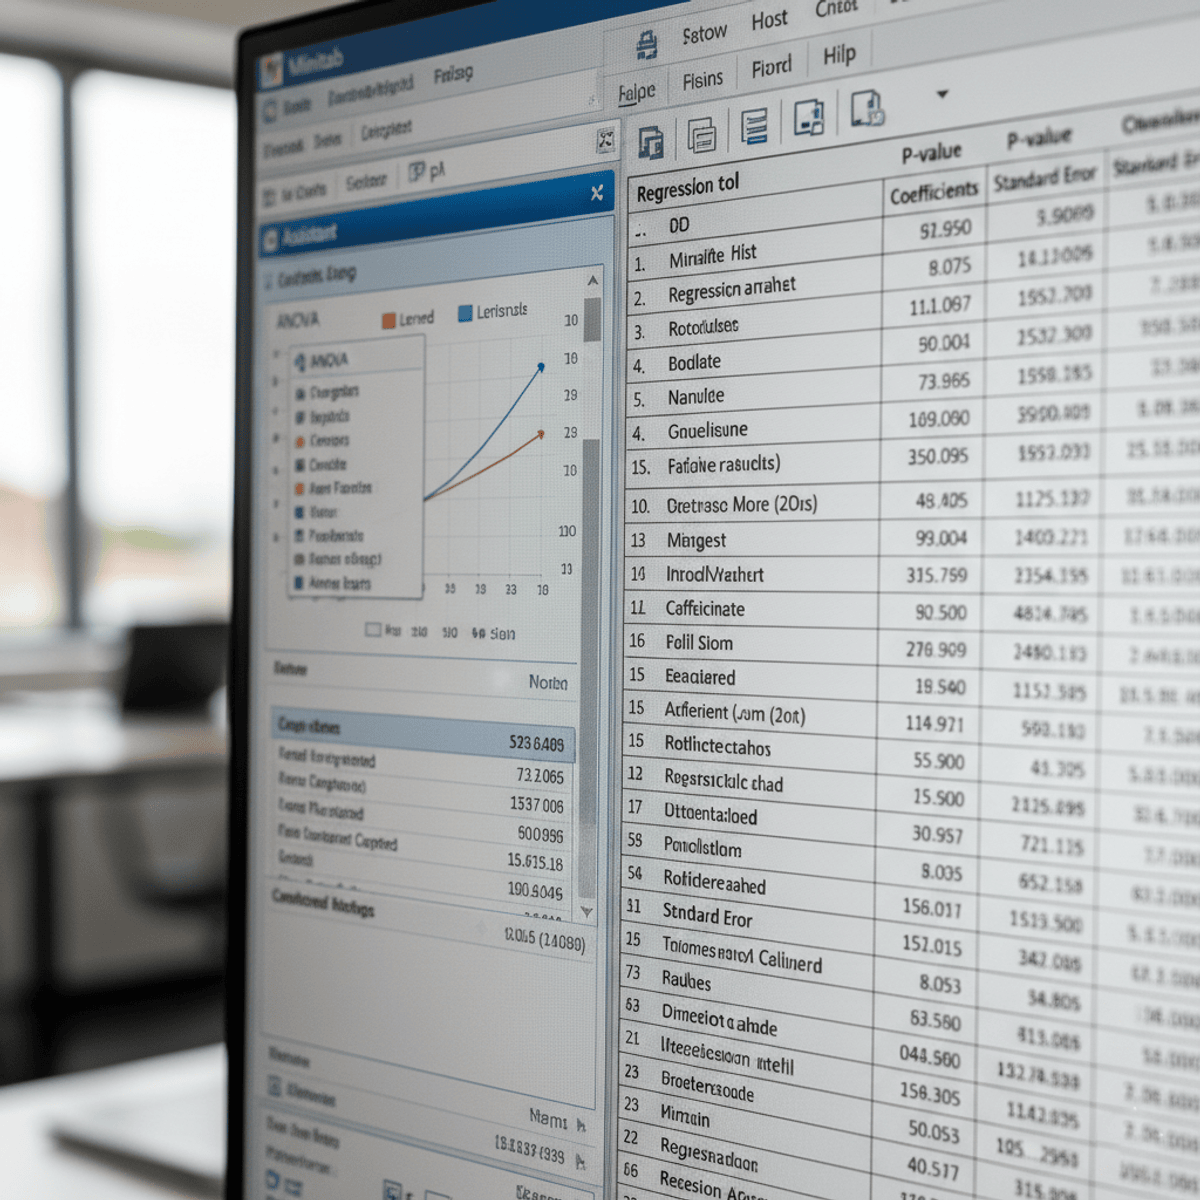
This course provides a practical, industry-focused introduction to data analytics using Minitab, designed for learners who want to move beyond theory and develop job-ready analytical skills. Learners will explore core statistical concepts such as descriptive statistics, hypothesis testing, correlation, ANOVA, and regression, and apply them to real datasets from companies such as Reliance, Infosys, Tech Mahindra, and Colgate Palmolive. The course also integrates Microsoft Excel regression tools, enabling learners to expand their analytical toolkit.
What makes this course unique is its strong emphasis on applied learning through real corporate case studies and guided analysis using Minitab’s Assistant feature. Rather than focusing solely on formulas, the course emphasizes interpretation, validation, and business relevance—skills essential for analysts, managers, and professionals seeking to make confident, data-driven decisions.
Watch on Coursera ↗
(saves to browser)
Sign in to unlock AI tutor explanation · ⚡30
More on: Data Literacy
View skill →


Related AI Lessons
⚡
⚡
⚡
⚡
Python for Data Science — Handling Missing Values in Pandas
Medium · Programming
Roblox Data Engineering Interview Questions: Full DE Prep Guide
Dev.to · Gowtham Potureddi
Tesla Data Engineering Interview Questions: Full DE Prep Guide
Dev.to · Gowtham Potureddi
Exodus Point Data Engineering Interview Questions: Full DE Prep Guide
Dev.to · Gowtham Potureddi
🎓
Tutor Explanation