Analyze & Build Dashboards Using Excel Pivot Tables
Skills:
Data Literacy80%
Key Takeaways
Creates interactive dashboards using Excel Pivot Tables for data analysis
Original Description
By the end of this course, learners will be able to create Pivot Tables, analyze datasets, build interactive dashboards, and interpret business insights using Excel.
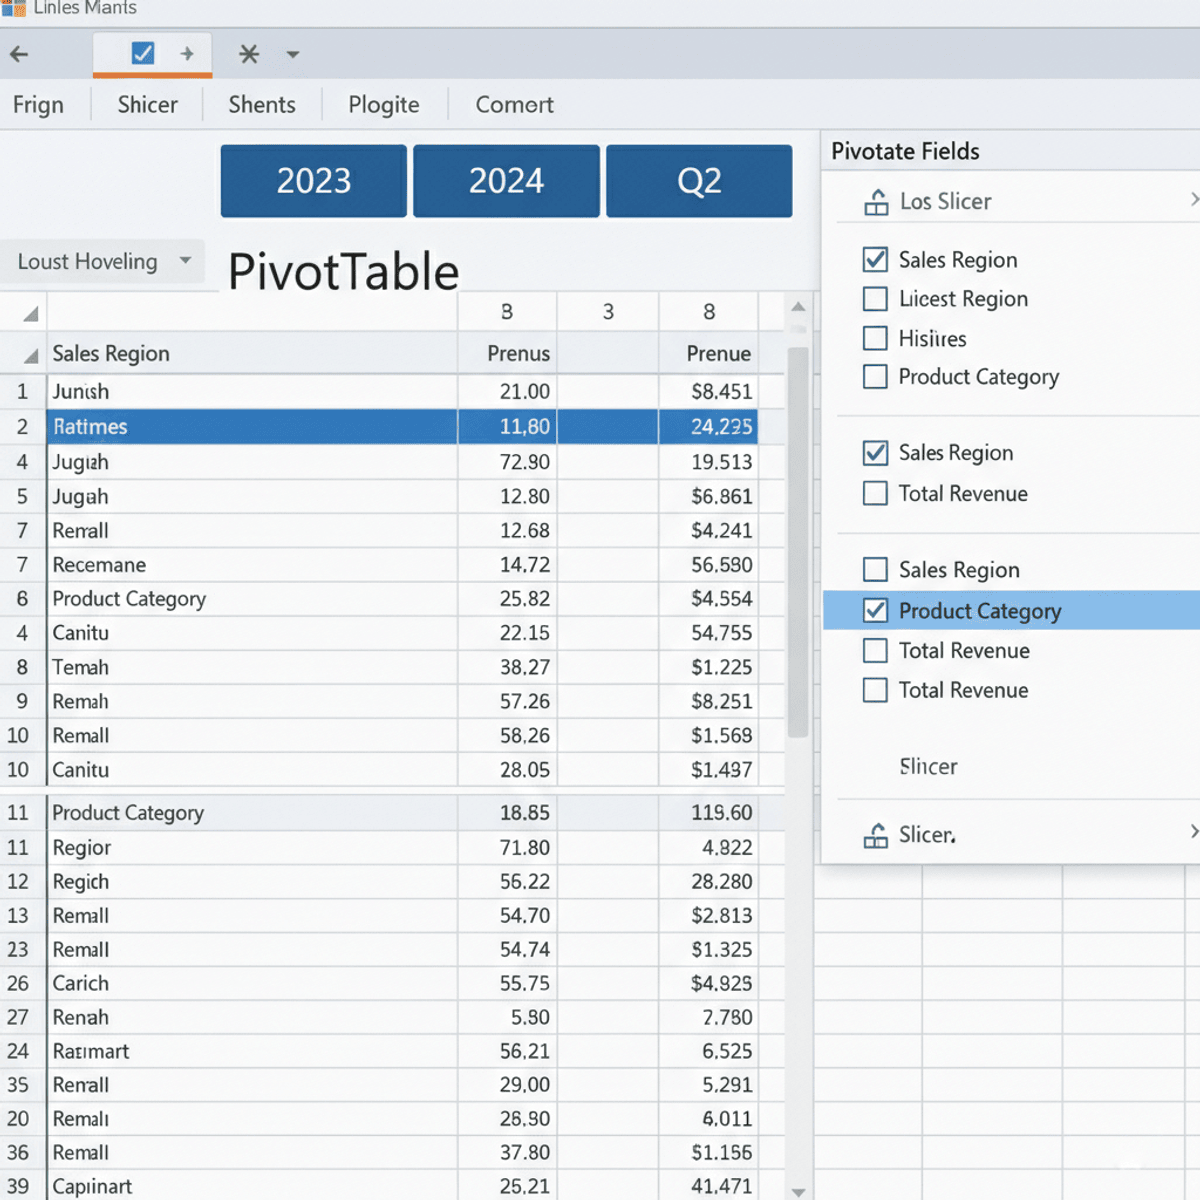
This course provides a complete, practical guide to working with Excel Pivot Tables and dashboards, starting from the fundamentals and progressing to real-world business and sales case studies. Learners will first master data preparation, Pivot Table creation, and Pivot Charts, ensuring a strong analytical foundation. They will then apply these skills to stock analysis, learning how to evaluate performance, compare trends, and calculate meaningful metrics.
What makes this course unique is its hands-on, project-driven approach. Learners will design interactive project dashboards, use slicers and filters, and apply best practices for formatting and usability. The course concludes with company and sales case studies, helping learners translate raw data into actionable insights that support decision-making.
With structured modules, practice quizzes, graded assessments, and real-world examples, this course is ideal for business analysts, Excel users, and professionals who want to strengthen their data analysis and dashboarding skills using Pivot Tables.
Watch on External: Coursera ↗
(saves to browser)
Sign in to unlock AI tutor explanation · ⚡30
More on: Data Literacy
View skill →


Related Reads
📰
📰
📰
📰
Star, Snowflake, or Galaxy? Choosing Your Data Warehouse Schema
Dev.to · grace wambua
DaDaDa: A Dataset for Data Pricing in Data Marketplaces
ArXiv cs.AI
I Tried to Predict the World Cup. What I Learned Had Nothing to Do with Football.
Medium · Data Science
Your Company Does Not Need More Dashboards. It Needs Better Decisions.
Medium · AI
🎓
Tutor Explanation