Using Descriptive Statistics to Analyze Data in R
Key Takeaways
Analyzes data using descriptive statistics in R
Original Description
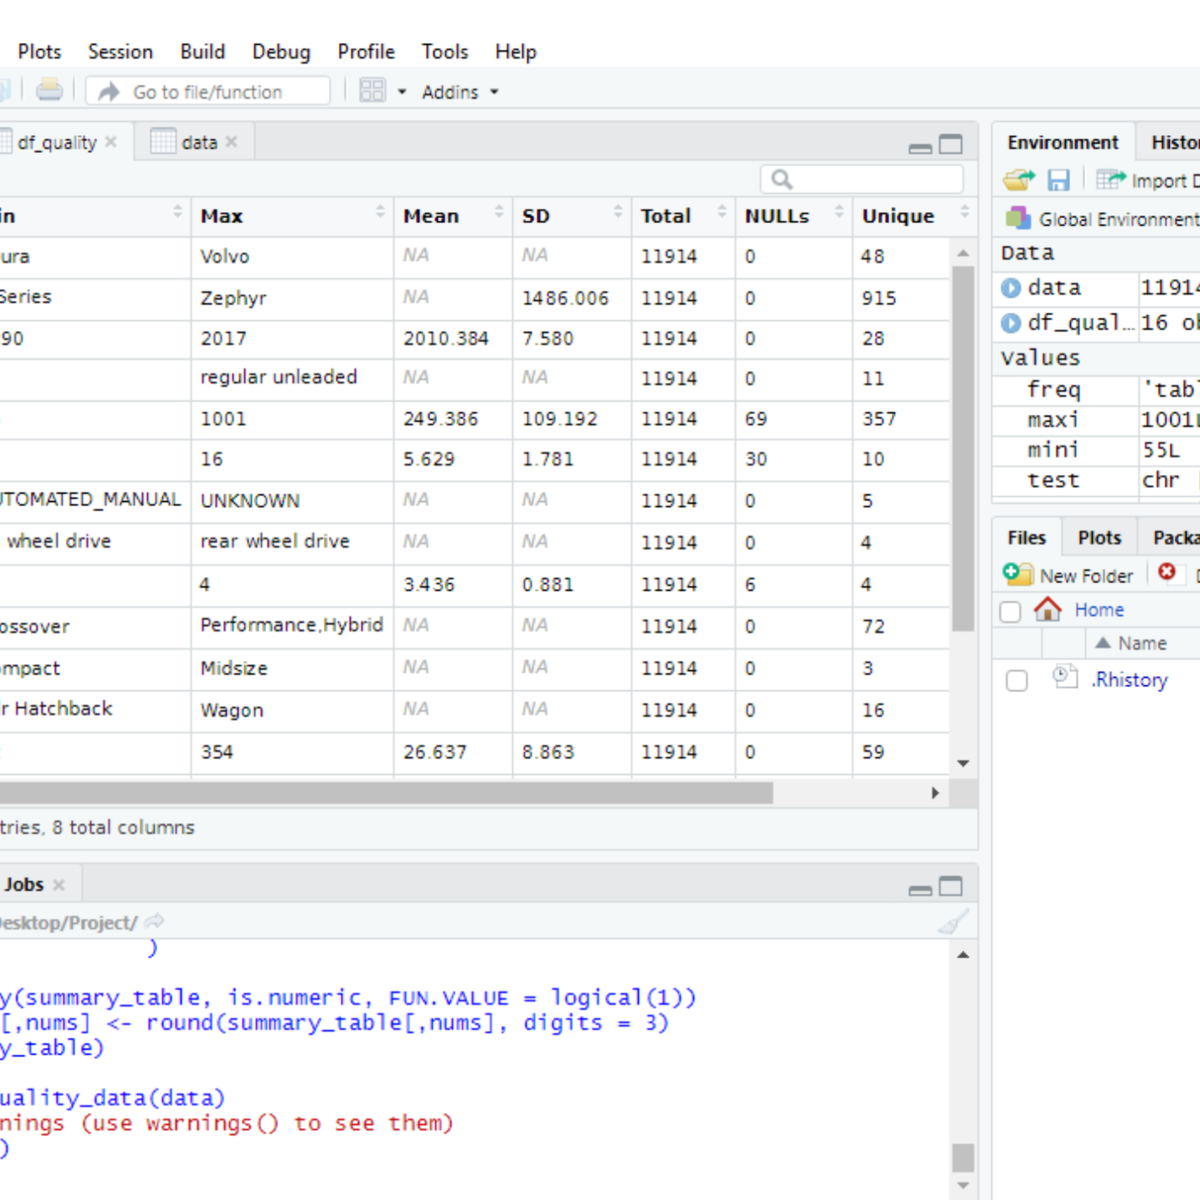
By the end of this project, you will create a data quality report file (exported to Excel in CSV format) from a dataset loaded in R, a free, open-source program that you can download. You will learn how to use the following descriptive statistical metrics in order to describe a dataset and how to calculate them in basic R with no additional libraries.
- minimum value
- maximum value
- average value
- standard deviation
- total number of values
- missing values
- unique values
- data types
You will then learn how to record the statistical metrics for each column of a dataset using a custom function created by you in R. The output of the function will be a ready-to-use data quality report. Finally, you will learn how to export this report to an external file.
A data quality report can be used to identify outliers, missing values, data types, anomalies, etc. that are present in your dataset. This is the first step to understand your dataset and let you plan what pre-processing steps are required to make your dataset ready for analysis.
Note: This course works best for learners who are based in the North America region. We’re currently working on providing the same experience in other regions.
Watch on External: Coursera ↗
(saves to browser)
Sign in to unlock AI tutor explanation · ⚡30
Related Reads
📰
📰
📰
📰
Veri Bilimi ve Bulut Bilişim Sistemi ile Bootcamp Deneyimi
Medium · Data Science
A Reader’s Guide to Humanity Centered Data: Where to Start
Medium · Data Science
SQL Subqueries: A Query Inside a Query (And Why That's Powerful)
Dev.to · Navas Herbert
Source Wars: The Chaos of Ten Conflicting Databases
Dev.to · Jeff Lowery
🎓
Tutor Explanation