Star Schemas & Track Changes
Key Takeaways
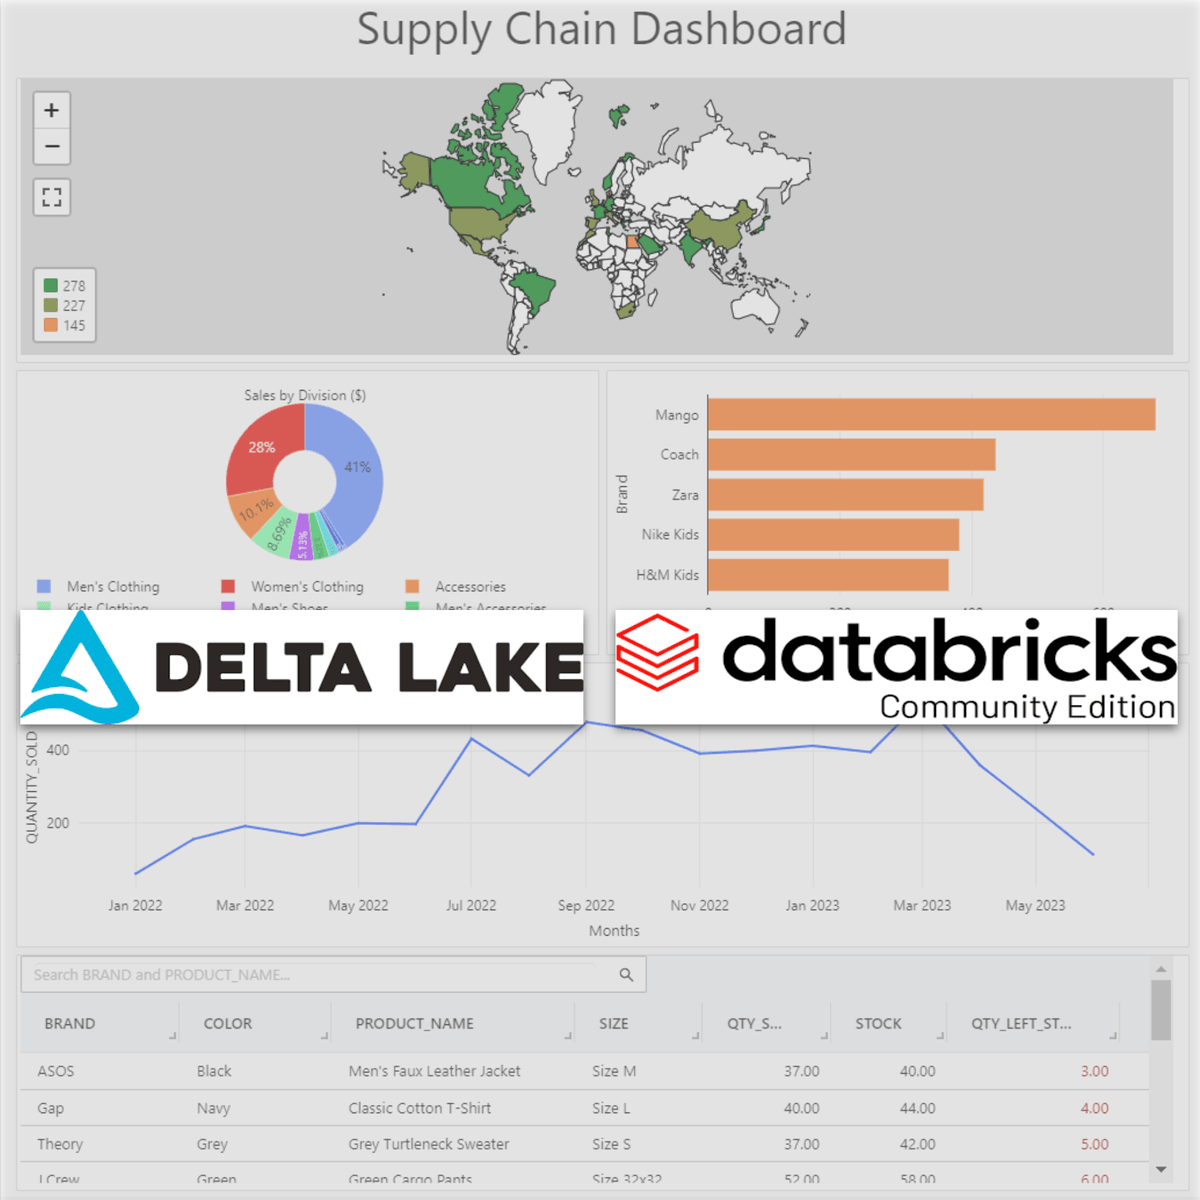
Applies star schemas and track changes for advanced dimensional modeling in enterprise-grade analytics systems
Original Description
Transform your data architecture skills with advanced dimensional modeling techniques that power enterprise-grade analytics systems. This course empowers data professionals to master the critical intersection of historical data tracking and dimensional model optimization.
This Short Course was created to help data analysts accomplish sophisticated data warehouse design that maintains data integrity while maximizing query performance. By completing this course, you'll be able to implement robust historical tracking mechanisms and systematically optimize dimensional models for better business intelligence outcomes.
By the end of this course, you will be able to:
Apply Type-2 slowly changing dimension techniques to preserve complete data history
Evaluate star schema structures and identify performance bottlenecks
Propose specific refinements that improve both analytical capabilities and query efficiency
This course is unique because it bridges the gap between theoretical dimensional modeling and practical implementation, providing hands-on experience with industry-standard tools like dbt and LookML that you'll use in real-world data engineering projects.
To be successful in this project, you should have a background in SQL, basic data modeling concepts, and familiarity with data warehouse fundamentals. (It is possible)
Watch on External: Coursera ↗
(saves to browser)
Sign in to unlock AI tutor explanation · ⚡30
More on: Data Warehousing
View skill →


Related Reads
📰
📰
📰
📰
I Built My Second ETL Pipeline. This Time, I Started Thinking Like a Data Engineer
Towards Data Science
JuiceFS Sync for PB-Scale Data Transfers: Resumable Sync, Encryption, and Bandwidth Control
Dev.to AI
How Airflow is using AI to make data engineering more resilient, not more complex
Medium · AI
What Can We Do When Memory Becomes the New Bottleneck in Data Engineering?
Towards Data Science
🎓
Tutor Explanation