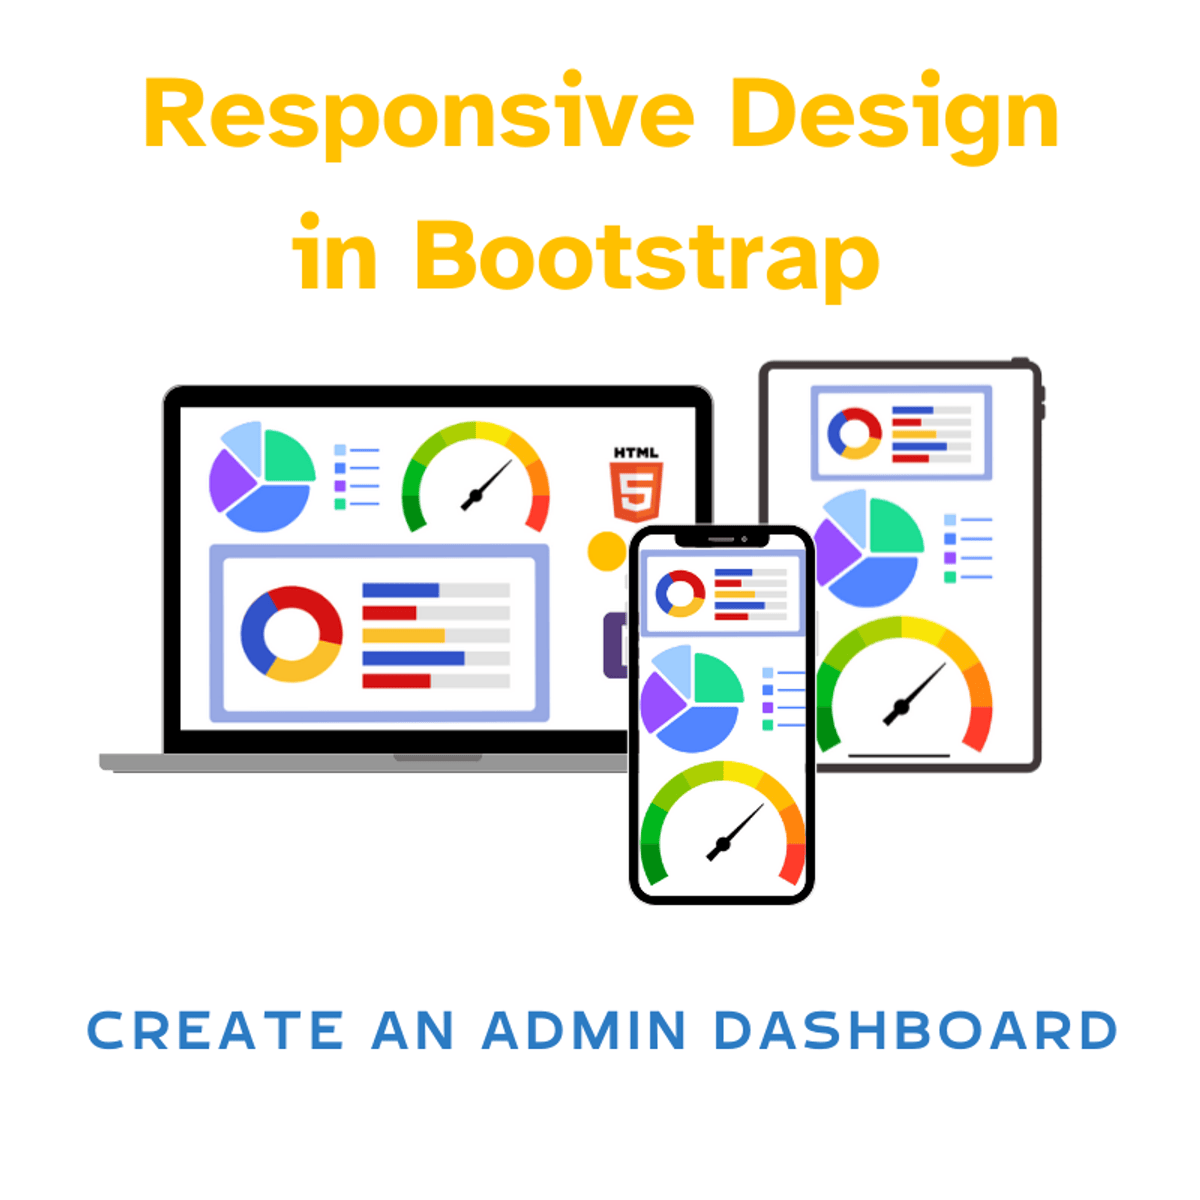
Responsive Design in Bootstrap: Create an Admin Dashboard
Key Takeaways
Builds a responsive admin dashboard using Bootstrap and its framework for creating responsive layouts and pre-styled components
Original Description
In this two-hour project-based course, you'll create responsive, sleek, and elegant admin dashboard pages using Bootstrap. This intermediate-level project aims to help web developers gain essential skills for building effective dashboards using Bootstrap which provides a robust framework for creating responsive layouts and pre-styled components, significantly speeding up the development process.
Specifically, you'll create data visualizations dashboard using Bootstrap and Chart.js. You will implement intuitive interfaces with Bootstrap tabs, responsive tables, and other components. You will also use Bootstrap's styling classes and font-awesome icons to enhance visual appeal of your dashboard.
You'll apply these skills and techniques to build an admin page for a project management pipeline using Bootstrap. This dashboard will offer a centralized interface for visualizing and managing project progress through various stages of the development lifecycle.
This project stands out because it teaches you how to build responsive dashboards quickly and easily. To succeed, you should be familiar with basic HTML5 structure, basic JavaScript syntax, and Bootstrap's grid system.
Watch on External: Coursera ↗
(saves to browser)
Sign in to unlock AI tutor explanation · ⚡30
More on: HTML & CSS
View skill →


Related Reads
📰
📰
📰
📰
Data structures your CS degree kind of glossed over
Dev.to · Athreya aka Maneshwar
Raincloud Plots with PtitPrince: See What Your Data Is Really Doing
Medium · Python
Confused Between Data Science, Data Analytics, Cloud Computing, DevOps, Data Engineering, and Generative AI? Here's How to Choose the Right Career
Dev.to AI
Data Science with AI — Join IDSA Janakpuri Today
Medium · Data Science
🎓
Tutor Explanation
