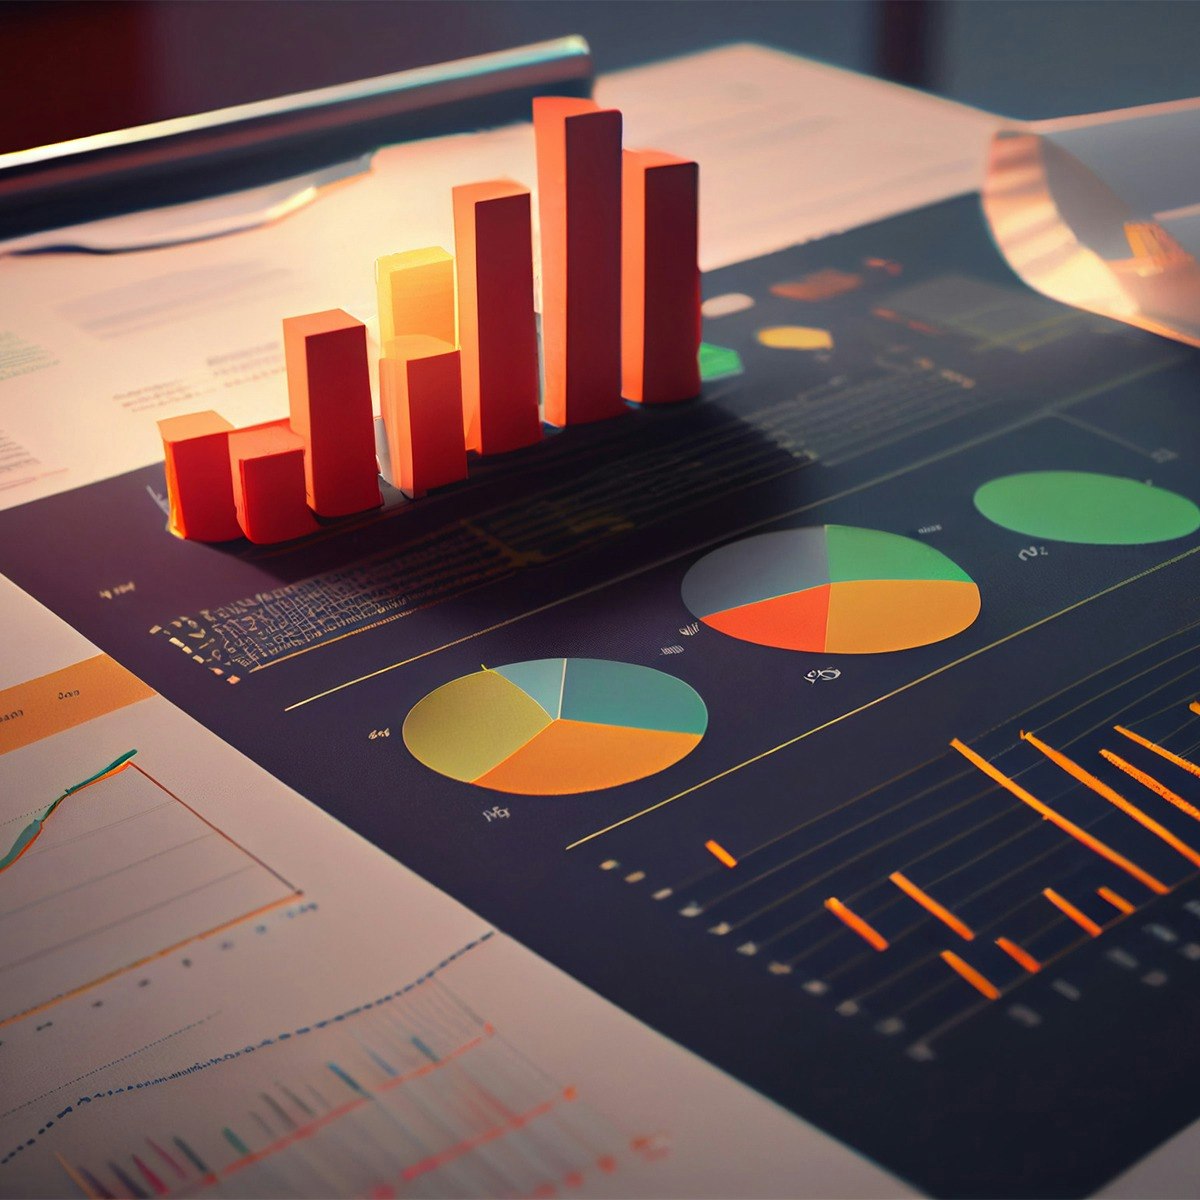
Reporting & Quality Assurance
Key Takeaways
Builds reporting and quality assurance skills for project management using Power BI
Original Description
Strong project outcomes depend on more than tracking tasks — they require reliable data, clear reporting, and the ability to diagnose what's going wrong before small issues become costly delays. In this course, you'll build the reporting and quality assurance skills that project managers use to keep teams accountable and stakeholders informed.
You'll connect live project data to Power BI to build dashboards that surface burn-down rates, velocity trends, and cost performance in one view. You'll enforce data quality in Asana by creating validation rules and running weekly audits that quantify error reduction over time. You'll also facilitate a root-cause analysis workshop, capture findings in a structured fishbone diagram, and convert workshop outputs into a tracked action plan with owners and milestones.
By the end, you'll be able to translate raw project data into stakeholder-ready insights, maintain the data integrity that makes those insights trustworthy, and lead structured problem-solving conversations that produce measurable results — skills that set project managers apart at every level.
Watch on External: Coursera ↗
(saves to browser)
Sign in to unlock AI tutor explanation · ⚡30
More on: Product Metrics
View skill →






Related Reads
🎓
Tutor Explanation

 DeepCamp AI