Project Sales: Excel Forecasting Functions
Key Takeaways
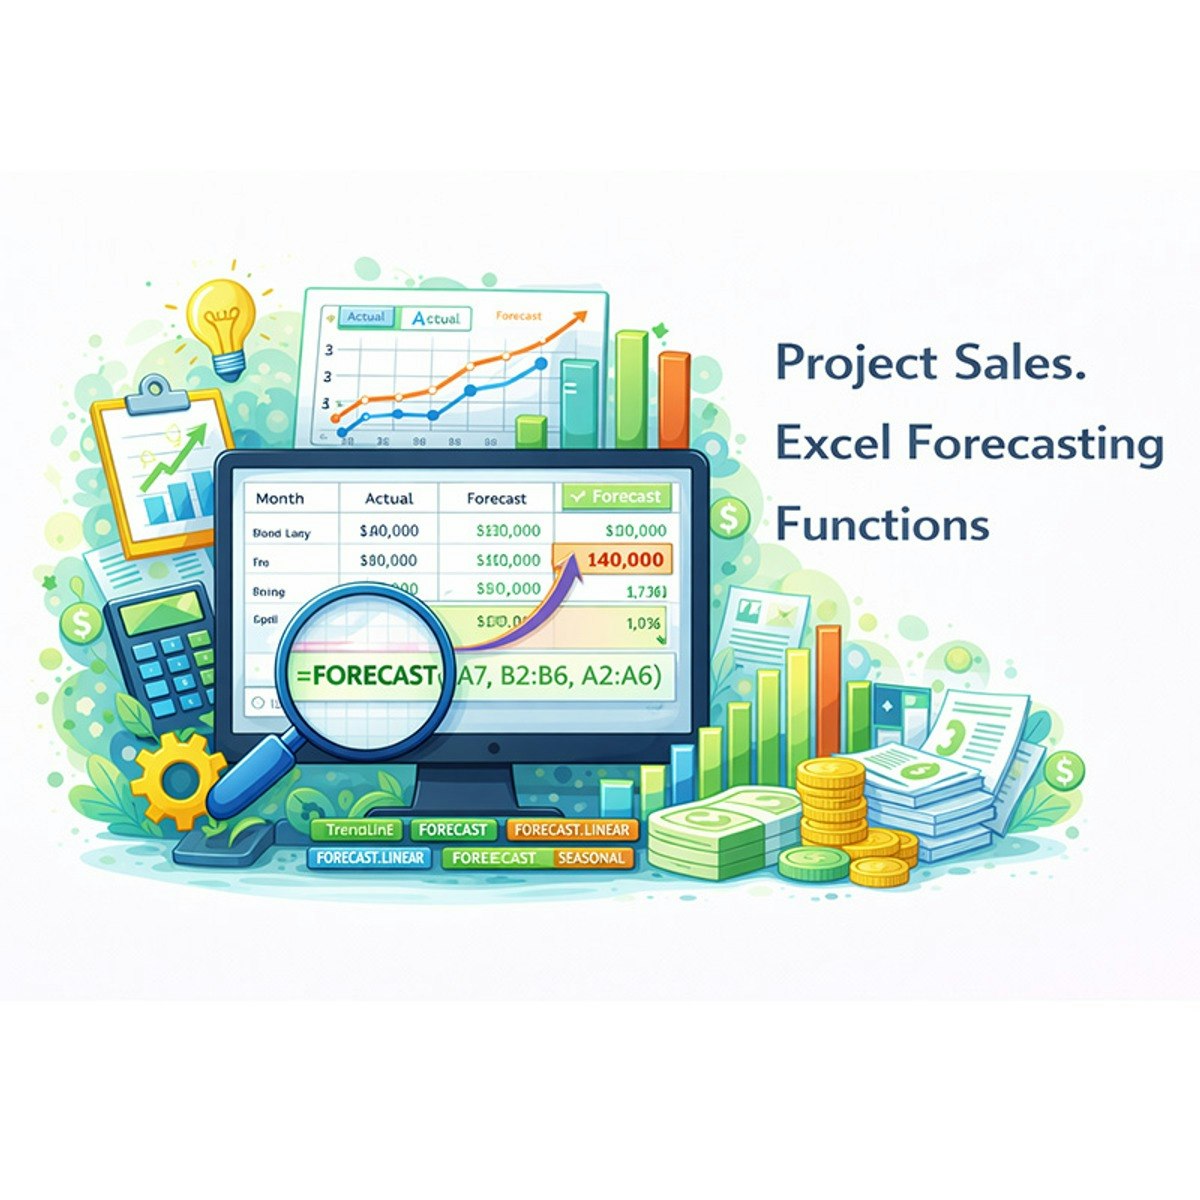
Uses Excel forecasting functions for sales analysis and prediction
Original Description
Ready to move beyond basic data entry and unlock the predictive power of Excel? This intermediate course, Project Sales: Excel Forecasting Functions, is designed for aspiring financial analysts, business planners, and data-driven professionals who want to build robust financial forecasts. You’ll learn to transform historical sales data into meaningful insights by calculating key performance metrics like Compound Annual Growth Rate (CAGR) and moving averages to understand underlying trends.
The course dives deep into scenario-based forecasting, a critical skill for strategic planning. You will master the application of Excel’s AVERAGE function for stable, "flat" projections and the GROWTH function for dynamic, "trend-based" scenarios. Through expert-led screencasts, hands-on exercises, and real-world case studies, you will build a complete sales forecast from start to finish. To succeed in this course, you should have a basic familiarity with Excel functions and an understanding of concepts like revenue and sales data. You will leave with the ability to not just calculate the future, but to model multiple futures, communicate your findings, and drive data-informed decisions with confidence.
Watch on External: Coursera ↗
(saves to browser)
Sign in to unlock AI tutor explanation · ⚡30
Related AI Lessons
⚡
⚡
⚡
⚡
Müşteri Değerini Anlamak: RFM, CLTV ve Tahmine Dayalı CRM Analitiği
Medium · Machine Learning
Müşteri Değerini Anlamak: RFM, CLTV ve Tahmine Dayalı CRM Analitiği
Medium · Data Science
Müşteri Değerini Anlamak: RFM, CLTV ve Tahmine Dayalı CRM Analitiği
Medium · Python
Surviving the Data Science Behavioral Interview
Towards Data Science
🎓
Tutor Explanation
