ETL and Data Pipelines with Shell, Airflow and Kafka
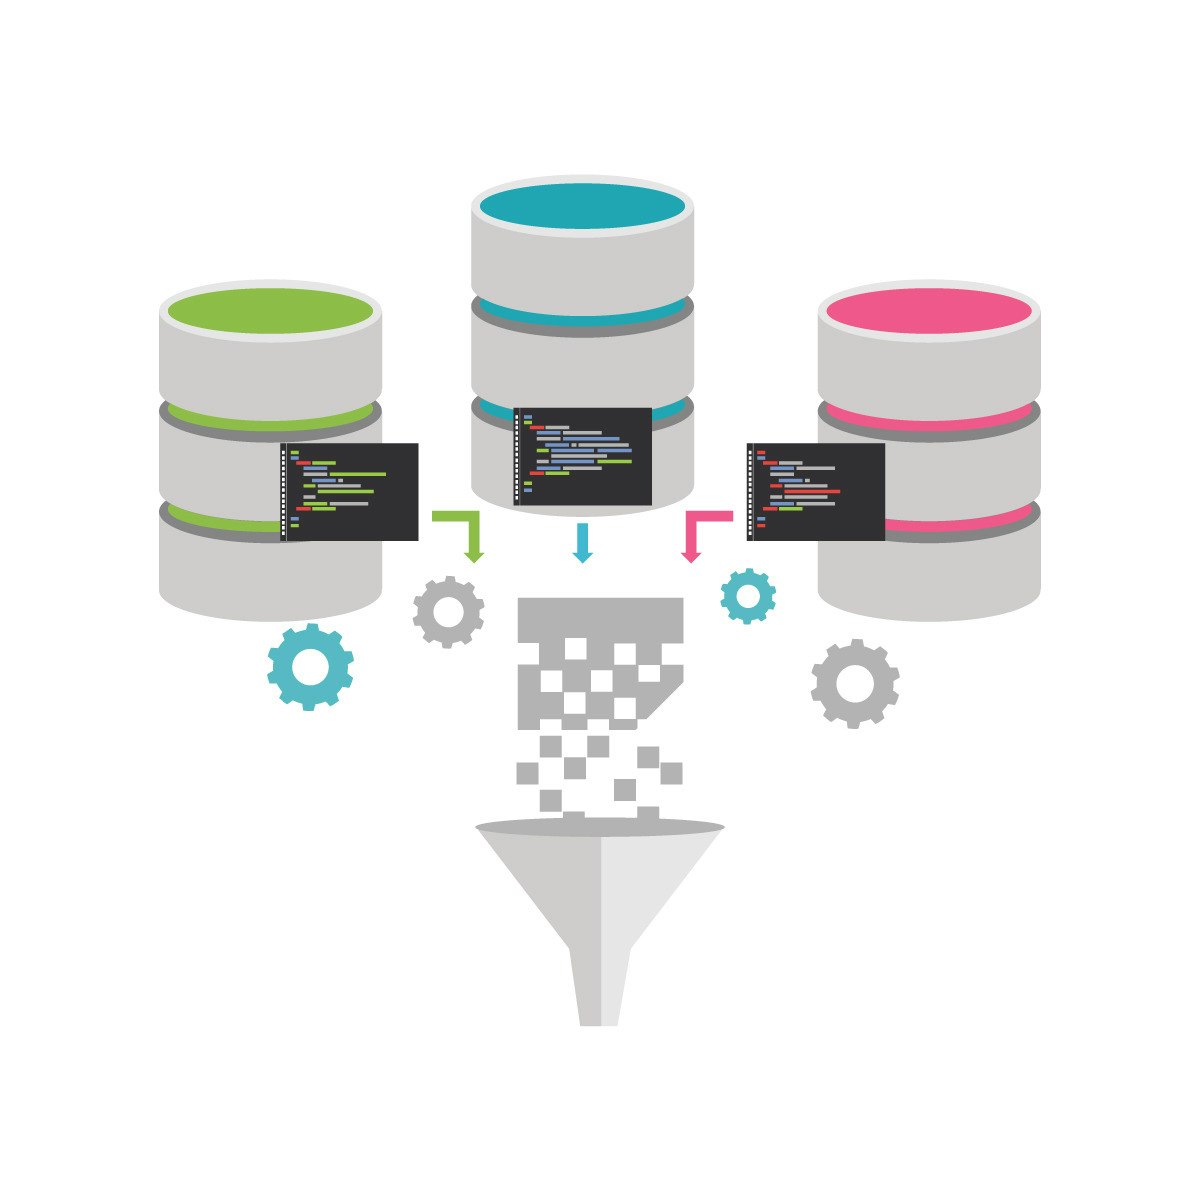
Delve into the two different approaches to converting raw data into analytics-ready data. One approach is the Extract, Transform, Load (ETL) process. The other contrasting approach is the Extract, Load, and Transform (ELT) process. ETL processes apply to data warehouses and data marts. ELT processes apply to data lakes, where the data is transformed on demand by the requesting/calling application.
In this course, you will learn about the different tools and techniques that are used with ETL and Data pipelines. Both ETL and ELT extract data from source systems, move the data through the data pipeline, and store the data in destination systems. During this course, you will experience how ELT and ETL processing differ and identify use cases for both. You will identify methods and tools used for extracting the data, merging extracted data either logically or physically, and for loading data into data repositories.
You will also define transformations to apply to source data to make the data credible, contextual, and accessible to data users. You will be able to outline some of the multiple methods for loading data into the destination system, verifying data quality, monitoring load failures, and the use of recovery mechanisms in case of failure.
By the end of this course, you will also know how to use Apache Airflow to build data pipelines as well be knowledgeable about the advantages of using this approach. You will also learn how to use Apache Kafka to build streaming pipelines as well as the core components of Kafka which include: brokers, topics, partitions, replications, producers, and consumers.
Finally, you will complete a shareable final project that enables you to demonstrate the skills you acquired in each module.
Watch on Coursera ↗
(saves to browser)
Sign in to unlock AI tutor explanation · ⚡30
More on: ETL Basics
View skill →


Related AI Lessons
⚡
⚡
⚡
⚡
Excel untuk Data Analytics: Cara Mudah Mengolah Data untuk Pemula
Medium · Data Science
I Tried to Find Out How Close I Am to the CEO of Roblox. The Answer Was Three.
Medium · Data Science
The Dying Symphony of Nature :
How climate change silences Cultures, Species, and Nature.
Medium · Data Science
Student Mental Health Analytics: An Interactive Dashboard in R Shiny
Medium · Data Science
🎓
Tutor Explanation
