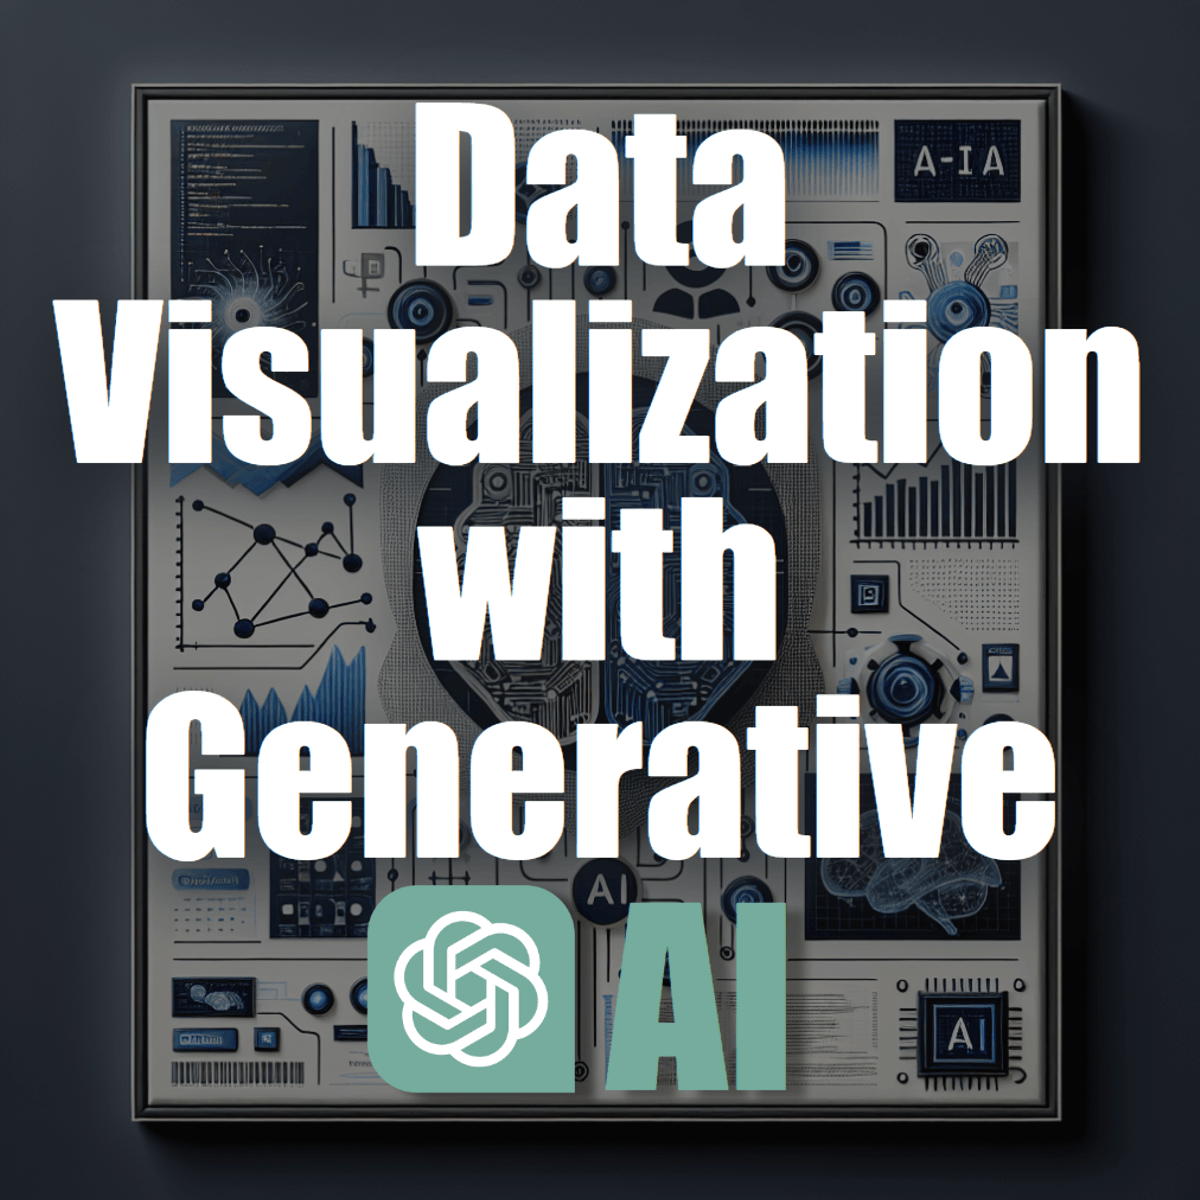
Data Visualization with OpenAI API: Generate code with GenAI
Key Takeaways
Generates code with GenAI for data visualization and analysis using OpenAI API
Original Description
In this 2-hour long project-based course, you will learn the basics of communicating with the OpenAI API through prompts specifically designed for Python code generation aimed at data visualization and analysis. This course is tailored to address a unique real-world scenario where you have been hired by an online toy store company called Toy Trendz to help them analyze their product sales data. They have provided you with a sales dataset related to the year 2018 and have presented analytical questions that require effective visualizations.
The challenge in this project lies in Toy Trendz's desire for a system that can convert human language into visualizations based on the data. You will start by learning how to effectively prompt GPT-4 to generate Python code, unlocking the power of natural language understanding to create customized data visualizations.
To get the most out of this course, you'll need access to the OpenAI API and a basic understanding of data analysis concepts, including data types, data manipulation, along with some familiarity with Python.
This course is for those who are experienced data analysis with at least a basic knowledge in Python and want to explore the exciting applications of generative AI in data visualization and analysis.
Watch on External: Coursera ↗
(saves to browser)
Sign in to unlock AI tutor explanation · ⚡30
More on: AI Pair Programming
View skill →





Related Reads
📰
📰
📰
📰
12.4 Million US Business Registrations Are Sitting on State Open-Data Portals, Free
Dev.to · Brad Ju
Mau Naik Level? Ini Advanced Data Science Techniques untuk Data Analytics
Medium · Data Science
I Finally Understood AWS Data Pipelines After Following a Single Customer Click
Dev.to · Anupa Supul
Beyond the Basics: Streamlit, Dash, and Bokeh for Interactive Dashboards
Dev.to · RoyserVillanueva
🎓
Tutor Explanation

 DeepCamp AI